Zip Codes with the Highest Percentage of Population Employed in Legal Services & Support in Kannapolis, NC
RELATED REPORTS & OPTIONS
Legal Services & Support
Kannapolis
Compare Zip Codes
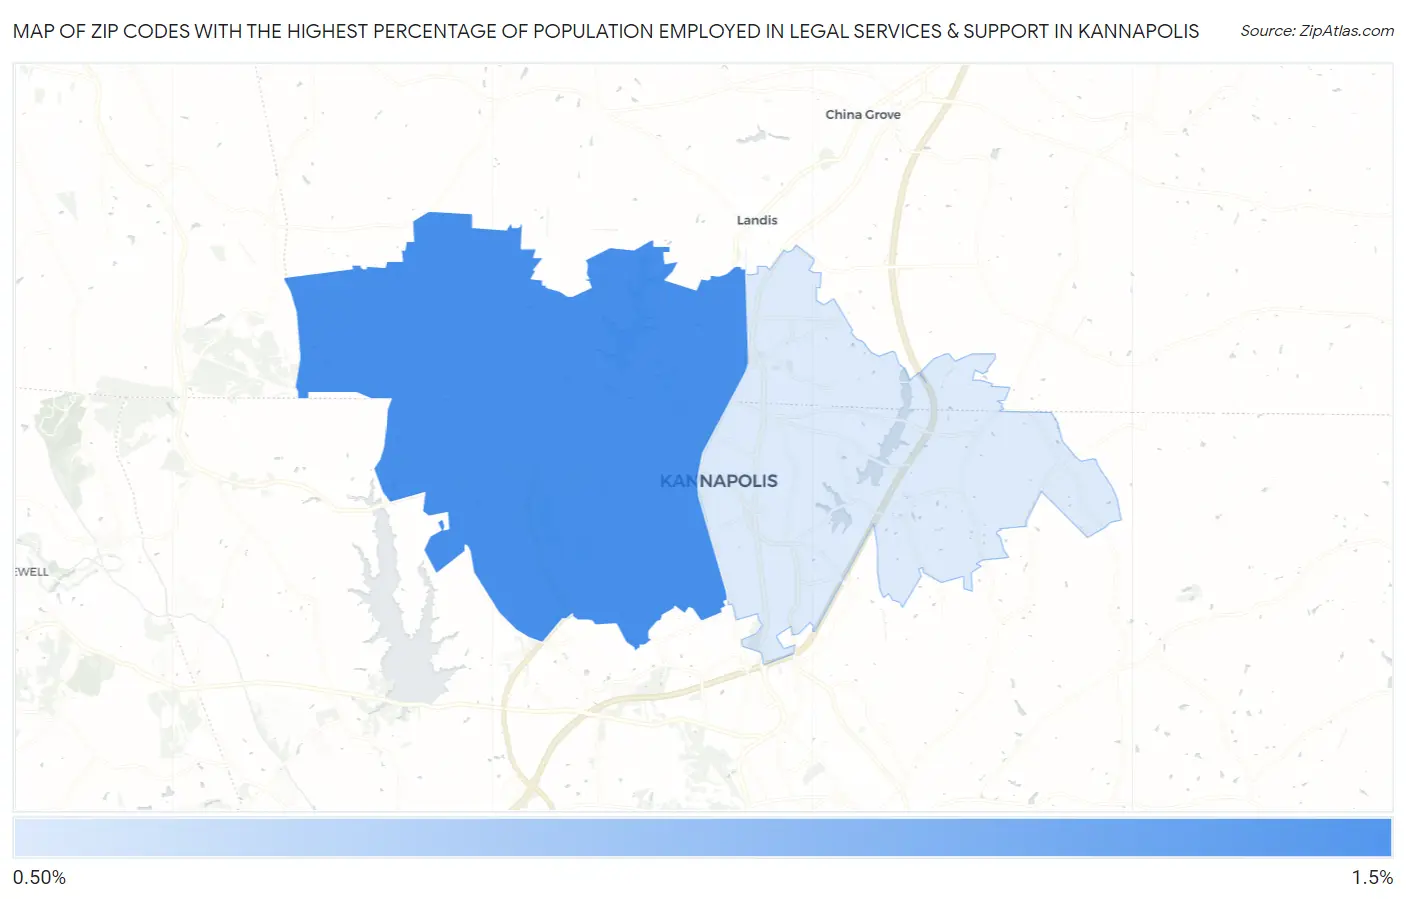
Map of Zip Codes with the Highest Percentage of Population Employed in Legal Services & Support in Kannapolis
0.0%
1.5%
Zip Codes with the Highest Percentage of Population Employed in Legal Services & Support in Kannapolis, NC
| Zip Code | % Employed | vs State | vs National | |
| 1. | 28081 | 1.2% | 0.86%(+0.321)#135 | 1.2%(+0.001)#6,613 |
| 2. | 28083 | 0.76% | 0.86%(-0.104)#219 | 1.2%(-0.424)#9,818 |
1
Common Questions
What are the Top Zip Codes with the Highest Percentage of Population Employed in Legal Services & Support in Kannapolis, NC?
Top Zip Codes with the Highest Percentage of Population Employed in Legal Services & Support in Kannapolis, NC are:
What zip code has the Highest Percentage of Population Employed in Legal Services & Support in Kannapolis, NC?
28081 has the Highest Percentage of Population Employed in Legal Services & Support in Kannapolis, NC with 1.2%.
What is the Percentage of Population Employed in Legal Services & Support in Kannapolis, NC?
Percentage of Population Employed in Legal Services & Support in Kannapolis is 1.1%.
What is the Percentage of Population Employed in Legal Services & Support in North Carolina?
Percentage of Population Employed in Legal Services & Support in North Carolina is 0.86%.
What is the Percentage of Population Employed in Legal Services & Support in the United States?
Percentage of Population Employed in Legal Services & Support in the United States is 1.2%.