Zip Codes with the Highest Percentage of Population Employed in Legal Services & Support in Waynesville, NC
RELATED REPORTS & OPTIONS
Legal Services & Support
Waynesville
Compare Zip Codes
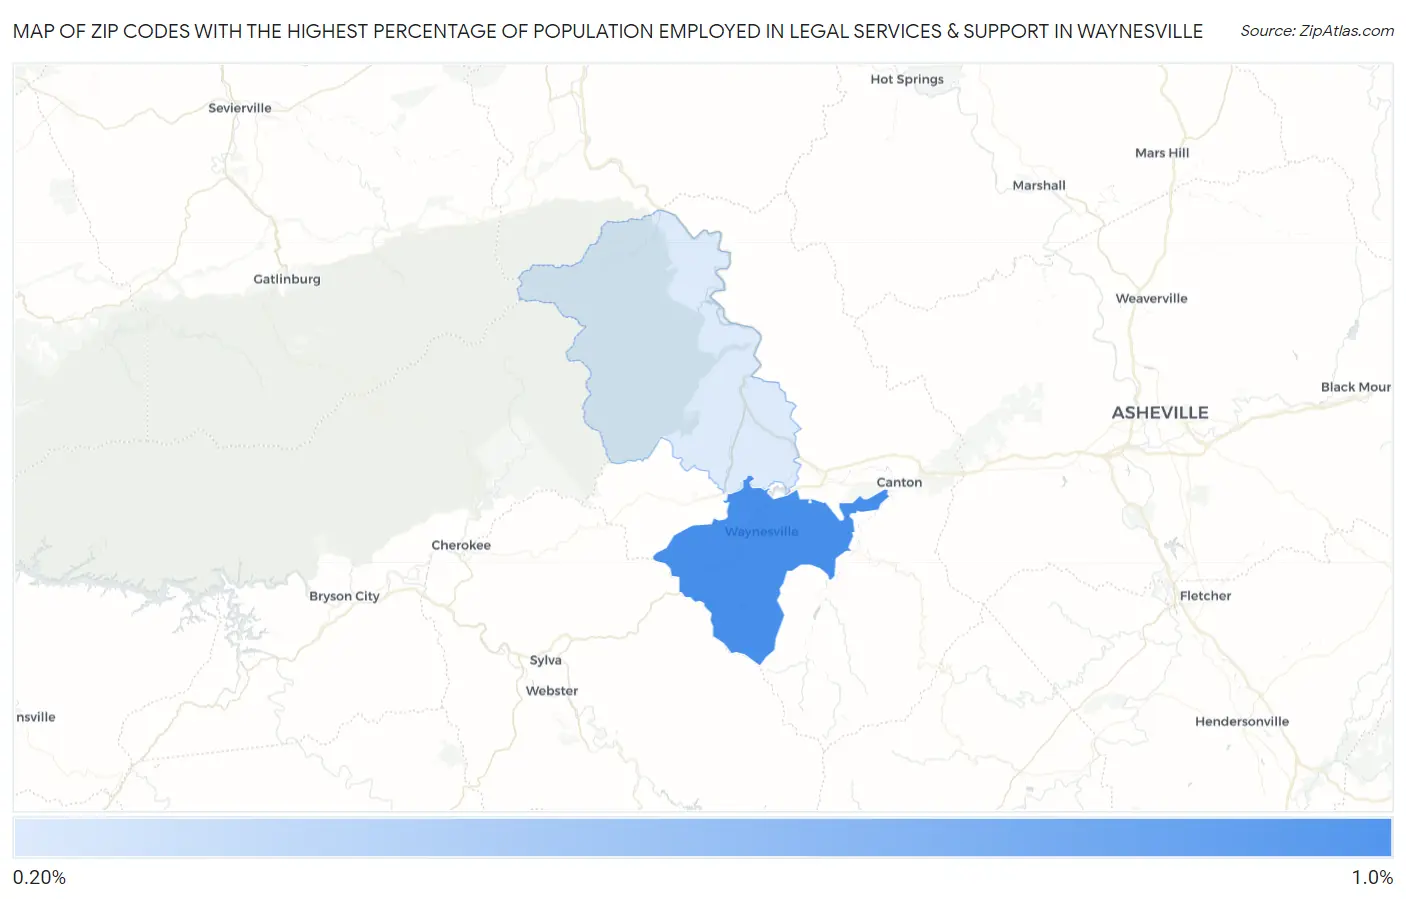
Map of Zip Codes with the Highest Percentage of Population Employed in Legal Services & Support in Waynesville
0.0%
1.0%
Zip Codes with the Highest Percentage of Population Employed in Legal Services & Support in Waynesville, NC
| Zip Code | % Employed | vs State | vs National | |
| 1. | 28786 | 0.84% | 0.86%(-0.028)#201 | 1.2%(-0.348)#9,137 |
| 2. | 28785 | 0.23% | 0.86%(-0.635)#407 | 1.2%(-0.955)#15,881 |
1
Common Questions
What are the Top Zip Codes with the Highest Percentage of Population Employed in Legal Services & Support in Waynesville, NC?
Top Zip Codes with the Highest Percentage of Population Employed in Legal Services & Support in Waynesville, NC are:
What zip code has the Highest Percentage of Population Employed in Legal Services & Support in Waynesville, NC?
28786 has the Highest Percentage of Population Employed in Legal Services & Support in Waynesville, NC with 0.84%.
What is the Percentage of Population Employed in Legal Services & Support in Waynesville, NC?
Percentage of Population Employed in Legal Services & Support in Waynesville is 1.5%.
What is the Percentage of Population Employed in Legal Services & Support in North Carolina?
Percentage of Population Employed in Legal Services & Support in North Carolina is 0.86%.
What is the Percentage of Population Employed in Legal Services & Support in the United States?
Percentage of Population Employed in Legal Services & Support in the United States is 1.2%.