Zip Codes with the Highest Percentage of Population Employed in Accommodation & Food Services in Kannapolis, NC
RELATED REPORTS & OPTIONS
Accommodation & Food Services
Kannapolis
Compare Zip Codes
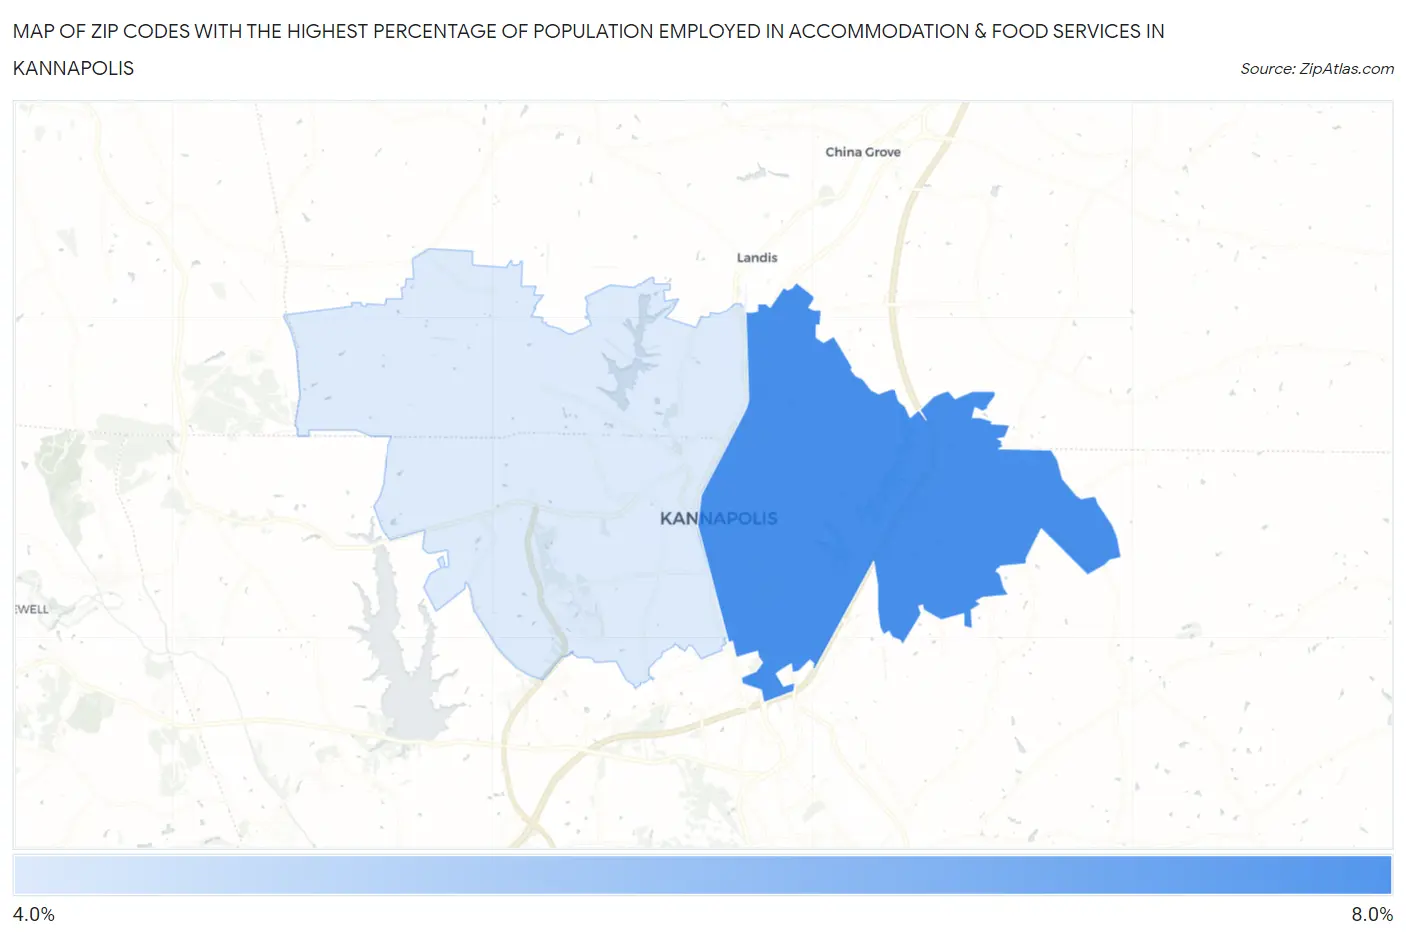
Map of Zip Codes with the Highest Percentage of Population Employed in Accommodation & Food Services in Kannapolis
0.0%
8.0%
Zip Codes with the Highest Percentage of Population Employed in Accommodation & Food Services in Kannapolis, NC
| Zip Code | % Employed | vs State | vs National | |
| 1. | 28083 | 7.8% | 7.0%(+0.708)#264 | 6.9%(+0.876)#8,348 |
| 2. | 28081 | 4.7% | 7.0%(-2.30)#530 | 6.9%(-2.13)#17,669 |
1
Common Questions
What are the Top Zip Codes with the Highest Percentage of Population Employed in Accommodation & Food Services in Kannapolis, NC?
Top Zip Codes with the Highest Percentage of Population Employed in Accommodation & Food Services in Kannapolis, NC are:
What zip code has the Highest Percentage of Population Employed in Accommodation & Food Services in Kannapolis, NC?
28083 has the Highest Percentage of Population Employed in Accommodation & Food Services in Kannapolis, NC with 7.8%.
What is the Percentage of Population Employed in Accommodation & Food Services in Kannapolis, NC?
Percentage of Population Employed in Accommodation & Food Services in Kannapolis is 7.7%.
What is the Percentage of Population Employed in Accommodation & Food Services in North Carolina?
Percentage of Population Employed in Accommodation & Food Services in North Carolina is 7.0%.
What is the Percentage of Population Employed in Accommodation & Food Services in the United States?
Percentage of Population Employed in Accommodation & Food Services in the United States is 6.9%.