Zip Codes with the Highest Percentage of Population Employed in Legal Services & Support in Henderson, NC
RELATED REPORTS & OPTIONS
Legal Services & Support
Henderson
Compare Zip Codes
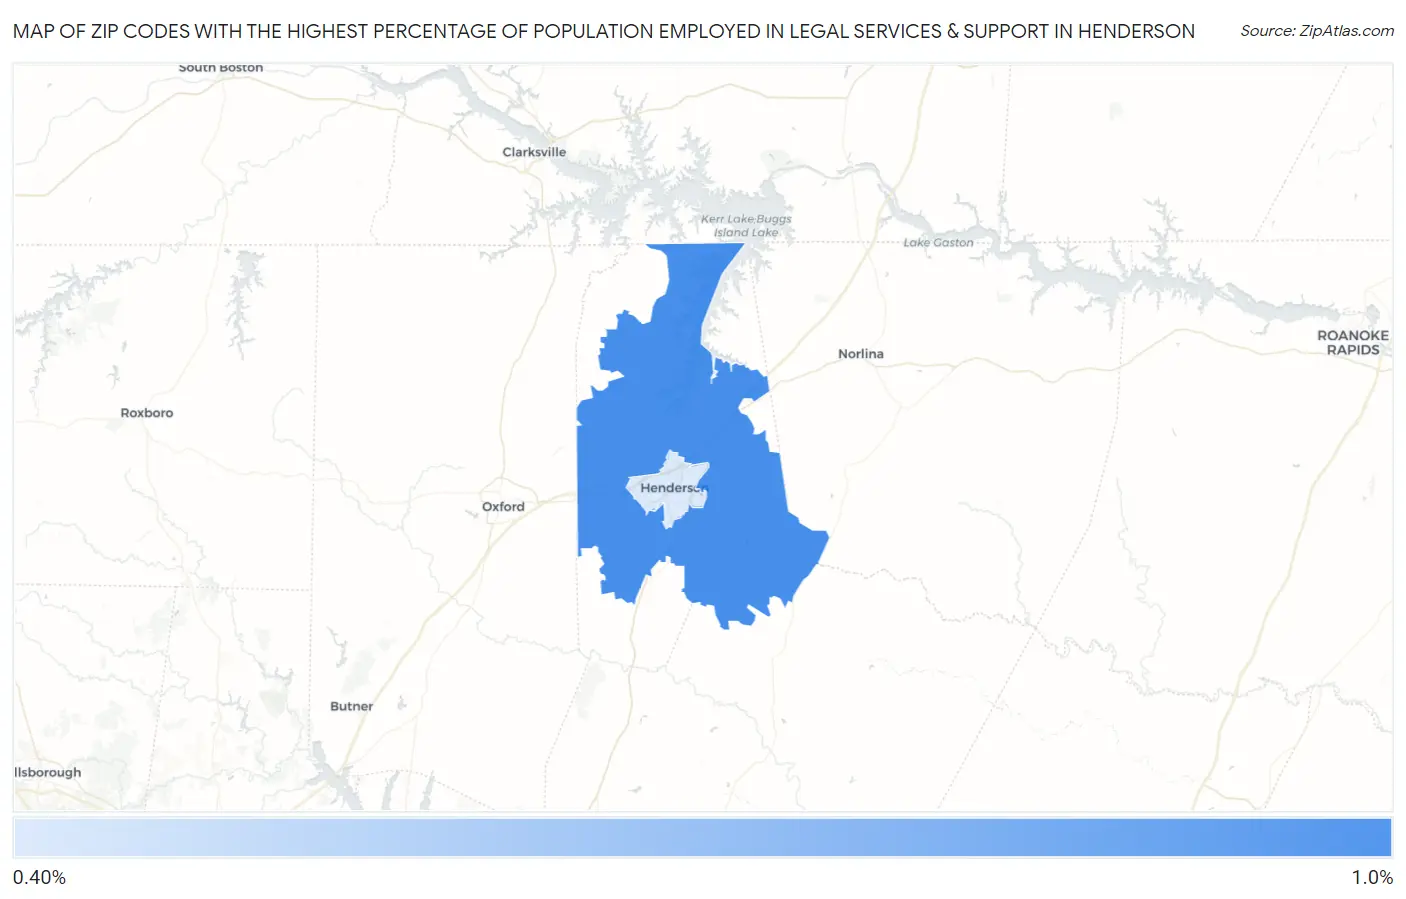
Map of Zip Codes with the Highest Percentage of Population Employed in Legal Services & Support in Henderson
0.0%
1.0%
Zip Codes with the Highest Percentage of Population Employed in Legal Services & Support in Henderson, NC
| Zip Code | % Employed | vs State | vs National | |
| 1. | 27537 | 0.84% | 0.86%(-0.027)#199 | 1.2%(-0.347)#9,124 |
| 2. | 27536 | 0.48% | 0.86%(-0.381)#326 | 1.2%(-0.700)#12,841 |
1
Common Questions
What are the Top Zip Codes with the Highest Percentage of Population Employed in Legal Services & Support in Henderson, NC?
Top Zip Codes with the Highest Percentage of Population Employed in Legal Services & Support in Henderson, NC are:
What zip code has the Highest Percentage of Population Employed in Legal Services & Support in Henderson, NC?
27537 has the Highest Percentage of Population Employed in Legal Services & Support in Henderson, NC with 0.84%.
What is the Percentage of Population Employed in Legal Services & Support in Henderson, NC?
Percentage of Population Employed in Legal Services & Support in Henderson is 0.49%.
What is the Percentage of Population Employed in Legal Services & Support in North Carolina?
Percentage of Population Employed in Legal Services & Support in North Carolina is 0.86%.
What is the Percentage of Population Employed in Legal Services & Support in the United States?
Percentage of Population Employed in Legal Services & Support in the United States is 1.2%.