Zip Codes with the Highest Percentage of Population Employed in Farming, Fishing & Forestry in Henderson, NC
RELATED REPORTS & OPTIONS
Farming, Fishing & Forestry
Henderson
Compare Zip Codes
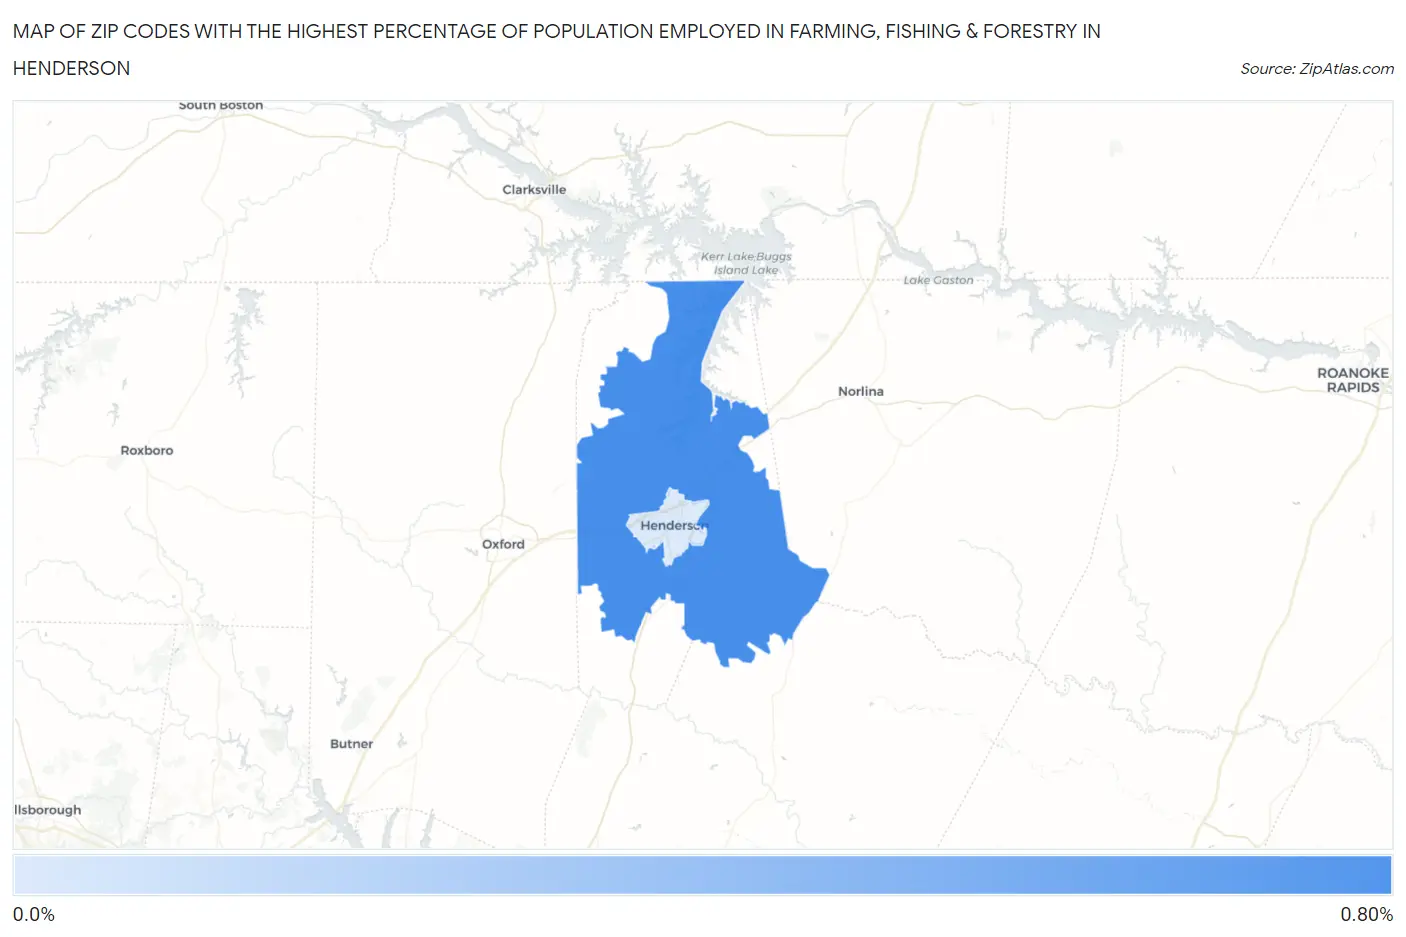
Map of Zip Codes with the Highest Percentage of Population Employed in Farming, Fishing & Forestry in Henderson
0.0%
0.80%
Zip Codes with the Highest Percentage of Population Employed in Farming, Fishing & Forestry in Henderson, NC
| Zip Code | % Employed | vs State | vs National | |
| 1. | 27537 | 0.73% | 0.51%(+0.225)#262 | 0.61%(+0.125)#11,206 |
| 2. | 27536 | 0.047% | 0.51%(-0.458)#501 | 0.61%(-0.559)#18,709 |
1
Common Questions
What are the Top Zip Codes with the Highest Percentage of Population Employed in Farming, Fishing & Forestry in Henderson, NC?
Top Zip Codes with the Highest Percentage of Population Employed in Farming, Fishing & Forestry in Henderson, NC are:
What zip code has the Highest Percentage of Population Employed in Farming, Fishing & Forestry in Henderson, NC?
27537 has the Highest Percentage of Population Employed in Farming, Fishing & Forestry in Henderson, NC with 0.73%.
What is the Percentage of Population Employed in Farming, Fishing & Forestry in North Carolina?
Percentage of Population Employed in Farming, Fishing & Forestry in North Carolina is 0.51%.
What is the Percentage of Population Employed in Farming, Fishing & Forestry in the United States?
Percentage of Population Employed in Farming, Fishing & Forestry in the United States is 0.61%.