Zip Codes with the Highest Percentage of Population Employed in Farming, Fishing & Forestry in Burlington, NC
RELATED REPORTS & OPTIONS
Farming, Fishing & Forestry
Burlington
Compare Zip Codes
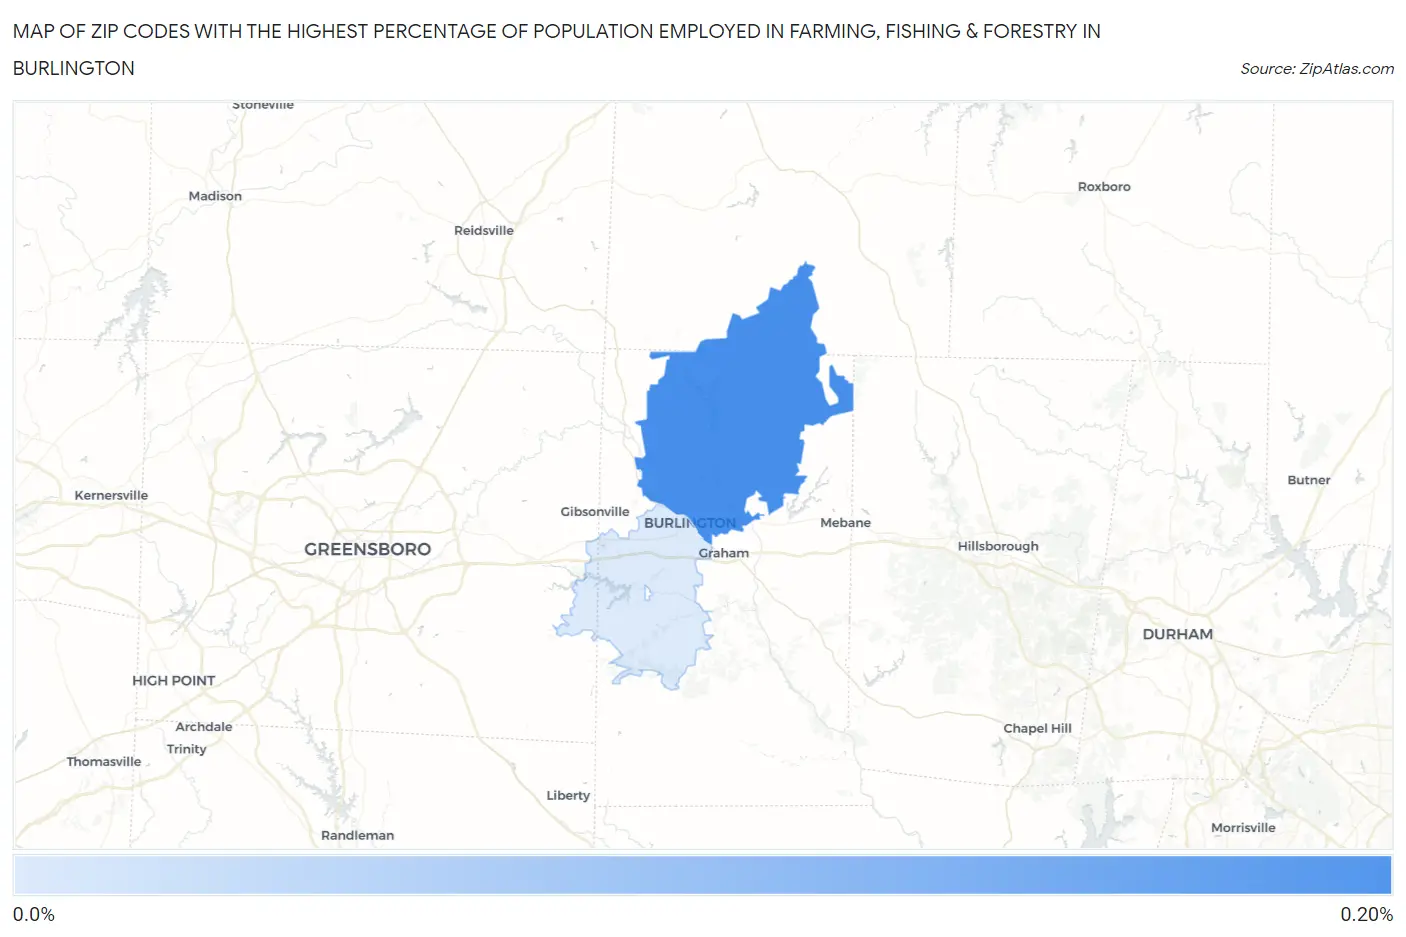
Map of Zip Codes with the Highest Percentage of Population Employed in Farming, Fishing & Forestry in Burlington
0.0%
0.20%
Zip Codes with the Highest Percentage of Population Employed in Farming, Fishing & Forestry in Burlington, NC
| Zip Code | % Employed | vs State | vs National | |
| 1. | 27217 | 0.16% | 0.51%(-0.343)#426 | 0.61%(-0.443)#16,708 |
| 2. | 27215 | 0.0088% | 0.51%(-0.496)#516 | 0.61%(-0.597)#19,169 |
1
Common Questions
What are the Top Zip Codes with the Highest Percentage of Population Employed in Farming, Fishing & Forestry in Burlington, NC?
Top Zip Codes with the Highest Percentage of Population Employed in Farming, Fishing & Forestry in Burlington, NC are:
What zip code has the Highest Percentage of Population Employed in Farming, Fishing & Forestry in Burlington, NC?
27217 has the Highest Percentage of Population Employed in Farming, Fishing & Forestry in Burlington, NC with 0.16%.
What is the Percentage of Population Employed in Farming, Fishing & Forestry in Burlington, NC?
Percentage of Population Employed in Farming, Fishing & Forestry in Burlington is 0.0074%.
What is the Percentage of Population Employed in Farming, Fishing & Forestry in North Carolina?
Percentage of Population Employed in Farming, Fishing & Forestry in North Carolina is 0.51%.
What is the Percentage of Population Employed in Farming, Fishing & Forestry in the United States?
Percentage of Population Employed in Farming, Fishing & Forestry in the United States is 0.61%.