Zip Codes with the Highest Percentage of Population Employed in Farming, Fishing & Forestry in High Point, NC
RELATED REPORTS & OPTIONS
Farming, Fishing & Forestry
High Point
Compare Zip Codes
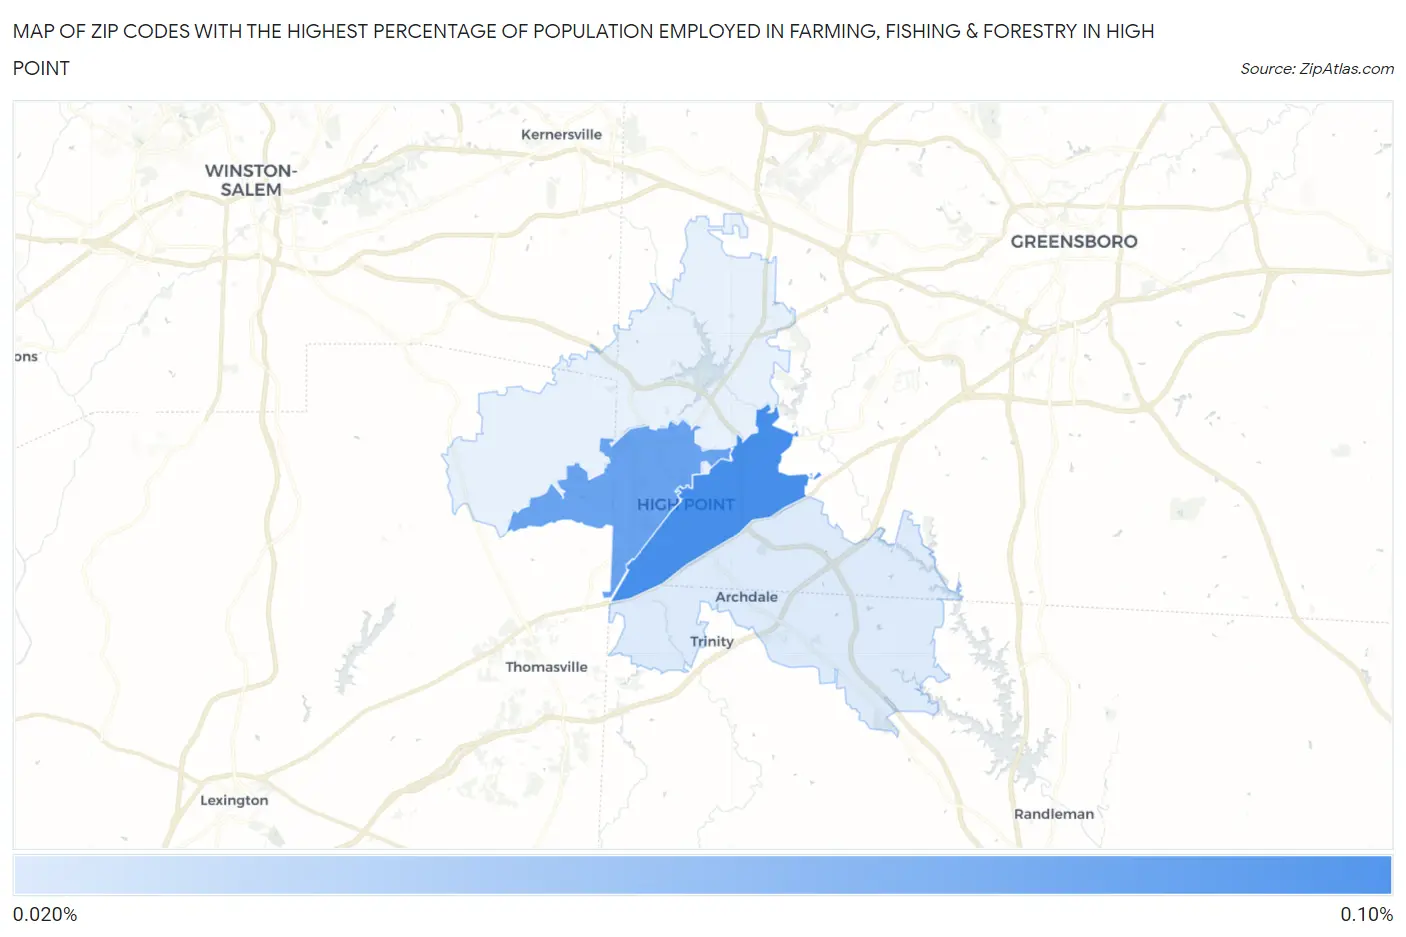
Map of Zip Codes with the Highest Percentage of Population Employed in Farming, Fishing & Forestry in High Point
0.0%
0.10%
Zip Codes with the Highest Percentage of Population Employed in Farming, Fishing & Forestry in High Point, NC
| Zip Code | % Employed | vs State | vs National | |
| 1. | 27260 | 0.086% | 0.51%(-0.419)#479 | 0.61%(-0.519)#17,997 |
| 2. | 27262 | 0.074% | 0.51%(-0.431)#483 | 0.61%(-0.531)#18,223 |
| 3. | 27263 | 0.029% | 0.51%(-0.476)#507 | 0.61%(-0.576)#18,968 |
1
Common Questions
What are the Top 3 Zip Codes with the Highest Percentage of Population Employed in Farming, Fishing & Forestry in High Point, NC?
Top 3 Zip Codes with the Highest Percentage of Population Employed in Farming, Fishing & Forestry in High Point, NC are:
What zip code has the Highest Percentage of Population Employed in Farming, Fishing & Forestry in High Point, NC?
27260 has the Highest Percentage of Population Employed in Farming, Fishing & Forestry in High Point, NC with 0.086%.
What is the Percentage of Population Employed in Farming, Fishing & Forestry in High Point, NC?
Percentage of Population Employed in Farming, Fishing & Forestry in High Point is 0.032%.
What is the Percentage of Population Employed in Farming, Fishing & Forestry in North Carolina?
Percentage of Population Employed in Farming, Fishing & Forestry in North Carolina is 0.51%.
What is the Percentage of Population Employed in Farming, Fishing & Forestry in the United States?
Percentage of Population Employed in Farming, Fishing & Forestry in the United States is 0.61%.