Zip Codes with the Highest Percentage of Population with a Degree in Liberal Arts and History in Burlington, NC
RELATED REPORTS & OPTIONS
Liberal Arts and History
Burlington
Compare Zip Codes
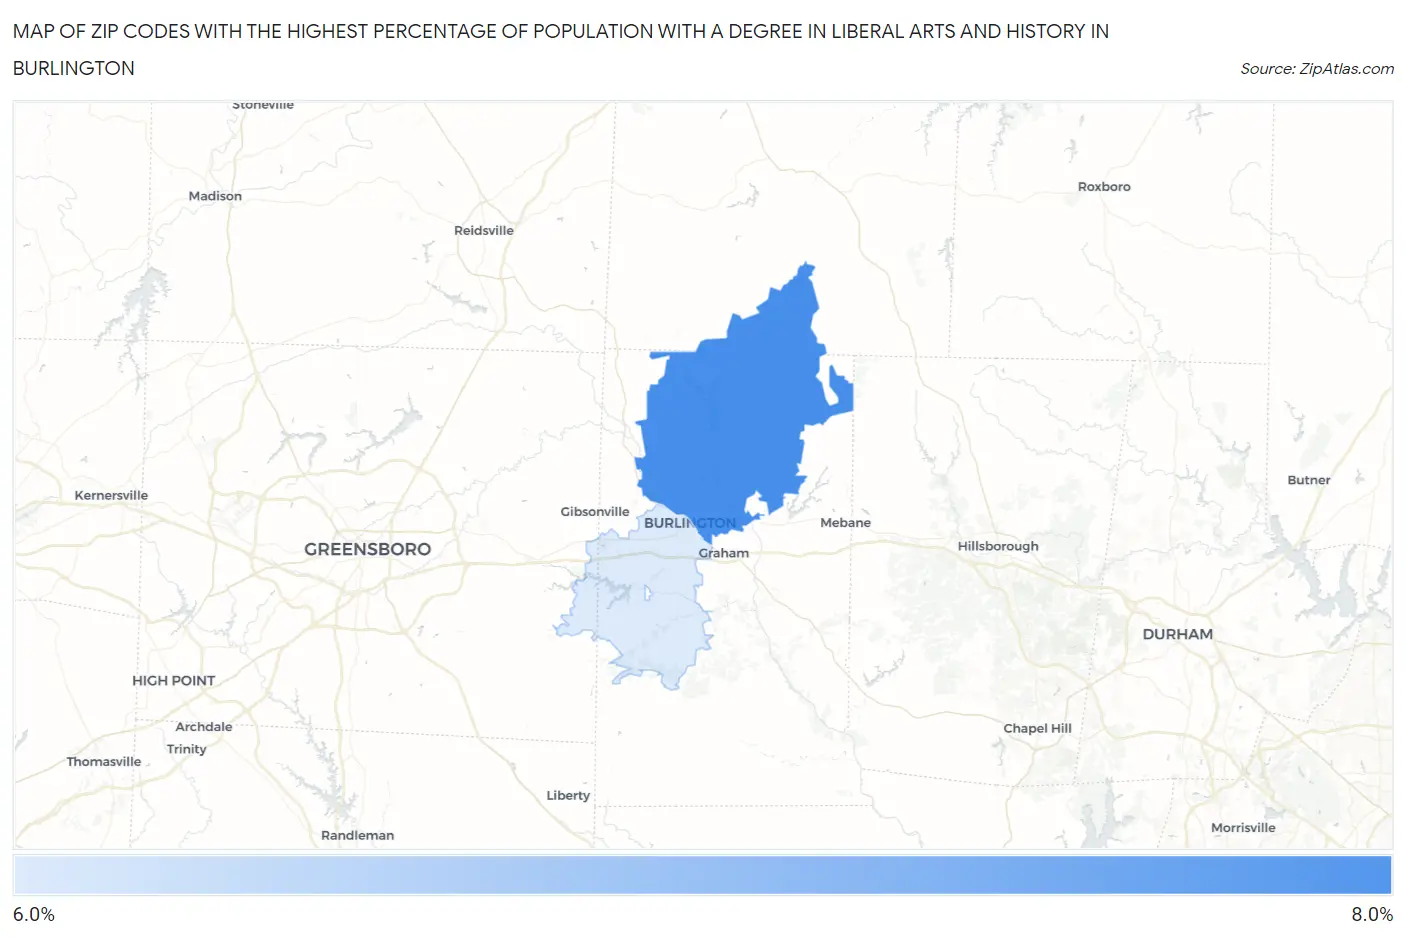
Map of Zip Codes with the Highest Percentage of Population with a Degree in Liberal Arts and History in Burlington
0.0%
8.0%
Zip Codes with the Highest Percentage of Population with a Degree in Liberal Arts and History in Burlington, NC
| Zip Code | % Graduates | vs State | vs National | |
| 1. | 27217 | 7.5% | 4.9%(+2.60)#154 | 4.9%(+2.63)#5,580 |
| 2. | 27215 | 6.1% | 4.9%(+1.21)#234 | 4.9%(+1.24)#8,225 |
1
Common Questions
What are the Top Zip Codes with the Highest Percentage of Population with a Degree in Liberal Arts and History in Burlington, NC?
Top Zip Codes with the Highest Percentage of Population with a Degree in Liberal Arts and History in Burlington, NC are:
What zip code has the Highest Percentage of Population with a Degree in Liberal Arts and History in Burlington, NC?
27217 has the Highest Percentage of Population with a Degree in Liberal Arts and History in Burlington, NC with 7.5%.
What is the Percentage of Population with a Degree in Liberal Arts and History in Burlington, NC?
Percentage of Population with a Degree in Liberal Arts and History in Burlington is 6.8%.
What is the Percentage of Population with a Degree in Liberal Arts and History in North Carolina?
Percentage of Population with a Degree in Liberal Arts and History in North Carolina is 4.9%.
What is the Percentage of Population with a Degree in Liberal Arts and History in the United States?
Percentage of Population with a Degree in Liberal Arts and History in the United States is 4.9%.