Zip Codes with the Highest Percentage of Population Employed in Agriculture, Fishing & Hunting in Muskegon, MI
RELATED REPORTS & OPTIONS
Agriculture, Fishing & Hunting
Muskegon
Compare Zip Codes
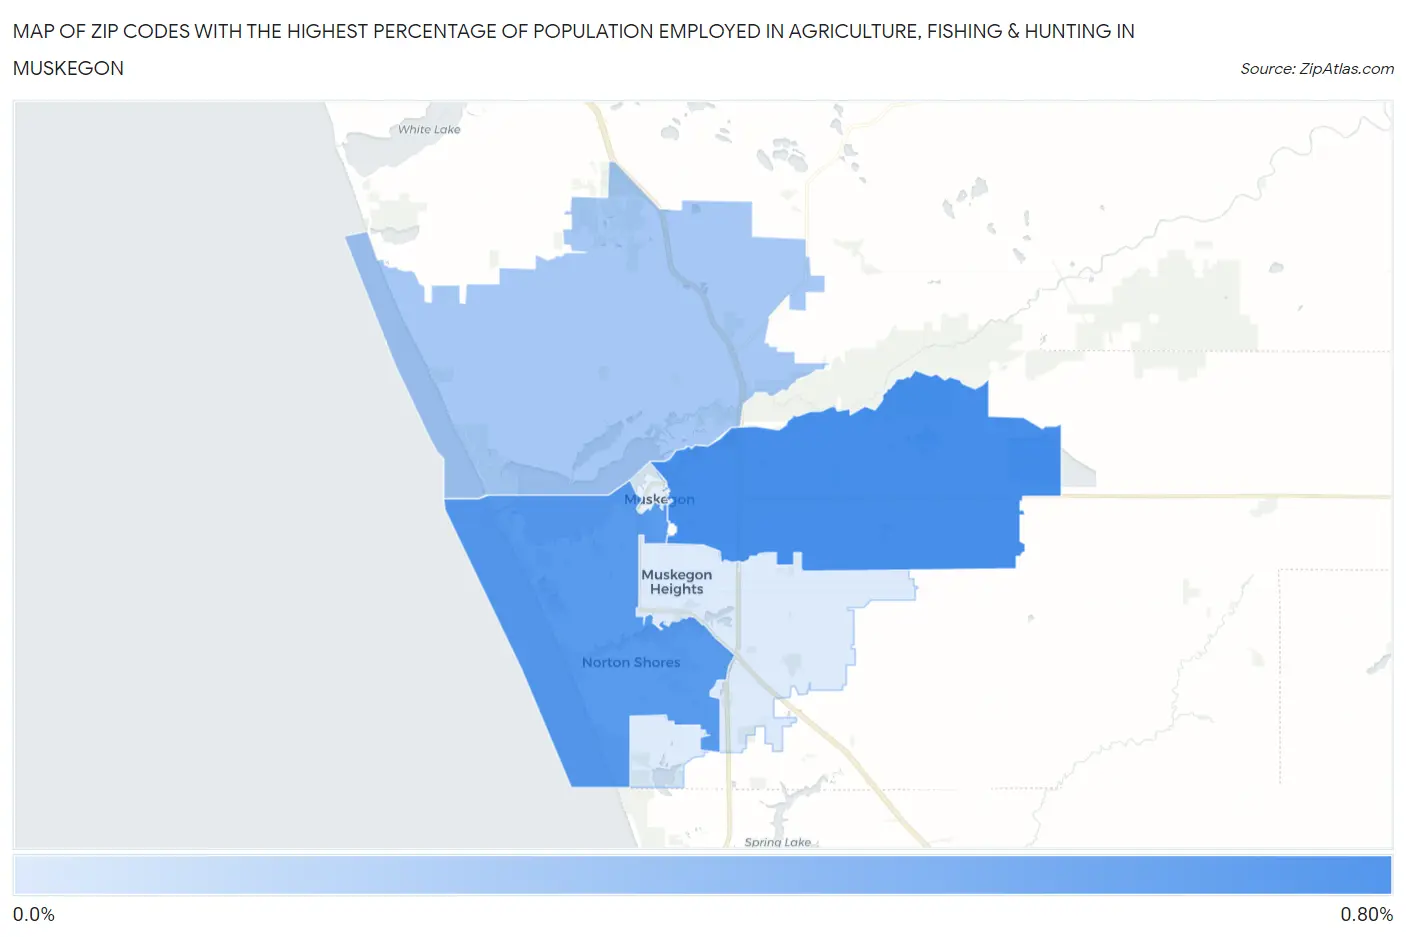
Map of Zip Codes with the Highest Percentage of Population Employed in Agriculture, Fishing & Hunting in Muskegon
0.0%
0.80%
Zip Codes with the Highest Percentage of Population Employed in Agriculture, Fishing & Hunting in Muskegon, MI
| Zip Code | % Employed | vs State | vs National | |
| 1. | 49442 | 0.62% | 0.98%(-0.363)#602 | 1.2%(-0.578)#18,345 |
| 2. | 49441 | 0.57% | 0.98%(-0.413)#624 | 1.2%(-0.628)#18,700 |
| 3. | 49445 | 0.31% | 0.98%(-0.674)#694 | 1.2%(-0.889)#21,058 |
| 4. | 49444 | 0.13% | 0.98%(-0.852)#782 | 1.2%(-1.07)#23,262 |
1
Common Questions
What are the Top 3 Zip Codes with the Highest Percentage of Population Employed in Agriculture, Fishing & Hunting in Muskegon, MI?
Top 3 Zip Codes with the Highest Percentage of Population Employed in Agriculture, Fishing & Hunting in Muskegon, MI are:
What zip code has the Highest Percentage of Population Employed in Agriculture, Fishing & Hunting in Muskegon, MI?
49442 has the Highest Percentage of Population Employed in Agriculture, Fishing & Hunting in Muskegon, MI with 0.62%.
What is the Percentage of Population Employed in Agriculture, Fishing & Hunting in Muskegon, MI?
Percentage of Population Employed in Agriculture, Fishing & Hunting in Muskegon is 0.76%.
What is the Percentage of Population Employed in Agriculture, Fishing & Hunting in Michigan?
Percentage of Population Employed in Agriculture, Fishing & Hunting in Michigan is 0.98%.
What is the Percentage of Population Employed in Agriculture, Fishing & Hunting in the United States?
Percentage of Population Employed in Agriculture, Fishing & Hunting in the United States is 1.2%.