Zip Codes with the Highest Percentage of Population Employed in Agriculture, Fishing & Hunting in East Lansing, MI
RELATED REPORTS & OPTIONS
Agriculture, Fishing & Hunting
East Lansing
Compare Zip Codes
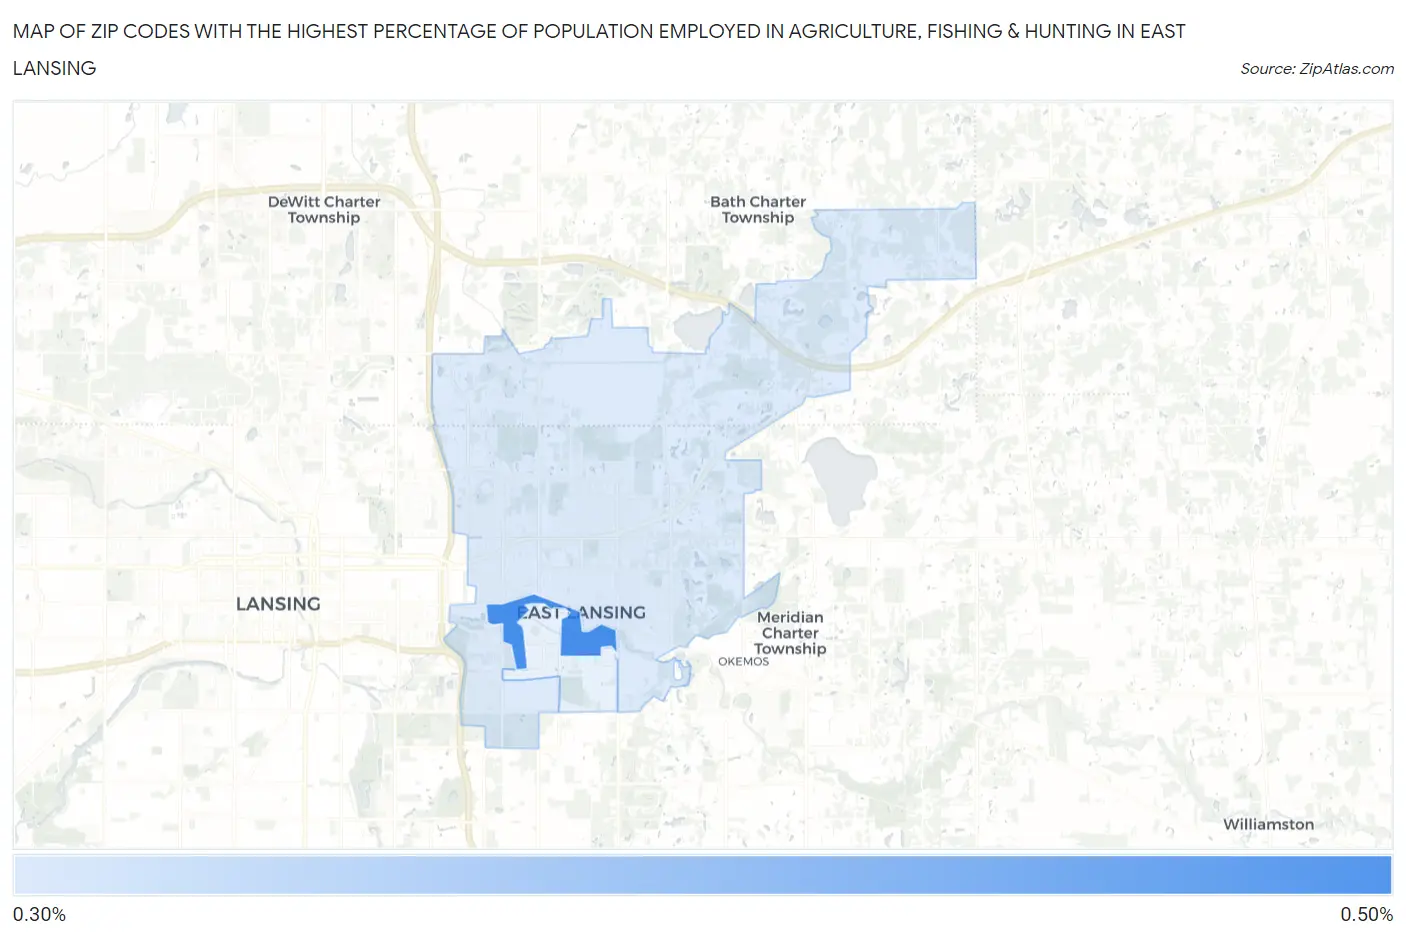
Map of Zip Codes with the Highest Percentage of Population Employed in Agriculture, Fishing & Hunting in East Lansing
0.0%
0.50%
Zip Codes with the Highest Percentage of Population Employed in Agriculture, Fishing & Hunting in East Lansing, MI
| Zip Code | % Employed | vs State | vs National | |
| 1. | 48825 | 0.49% | 0.98%(-0.498)#640 | 1.2%(-0.714)#19,395 |
| 2. | 48823 | 0.31% | 0.98%(-0.678)#695 | 1.2%(-0.893)#21,103 |
1
Common Questions
What are the Top Zip Codes with the Highest Percentage of Population Employed in Agriculture, Fishing & Hunting in East Lansing, MI?
Top Zip Codes with the Highest Percentage of Population Employed in Agriculture, Fishing & Hunting in East Lansing, MI are:
What zip code has the Highest Percentage of Population Employed in Agriculture, Fishing & Hunting in East Lansing, MI?
48825 has the Highest Percentage of Population Employed in Agriculture, Fishing & Hunting in East Lansing, MI with 0.49%.
What is the Percentage of Population Employed in Agriculture, Fishing & Hunting in East Lansing, MI?
Percentage of Population Employed in Agriculture, Fishing & Hunting in East Lansing is 0.42%.
What is the Percentage of Population Employed in Agriculture, Fishing & Hunting in Michigan?
Percentage of Population Employed in Agriculture, Fishing & Hunting in Michigan is 0.98%.
What is the Percentage of Population Employed in Agriculture, Fishing & Hunting in the United States?
Percentage of Population Employed in Agriculture, Fishing & Hunting in the United States is 1.2%.