Zip Codes with the Highest Percentage of Population Employed in Agriculture, Fishing & Hunting in Saint Clair Shores, MI
RELATED REPORTS & OPTIONS
Agriculture, Fishing & Hunting
Saint Clair Shores
Compare Zip Codes
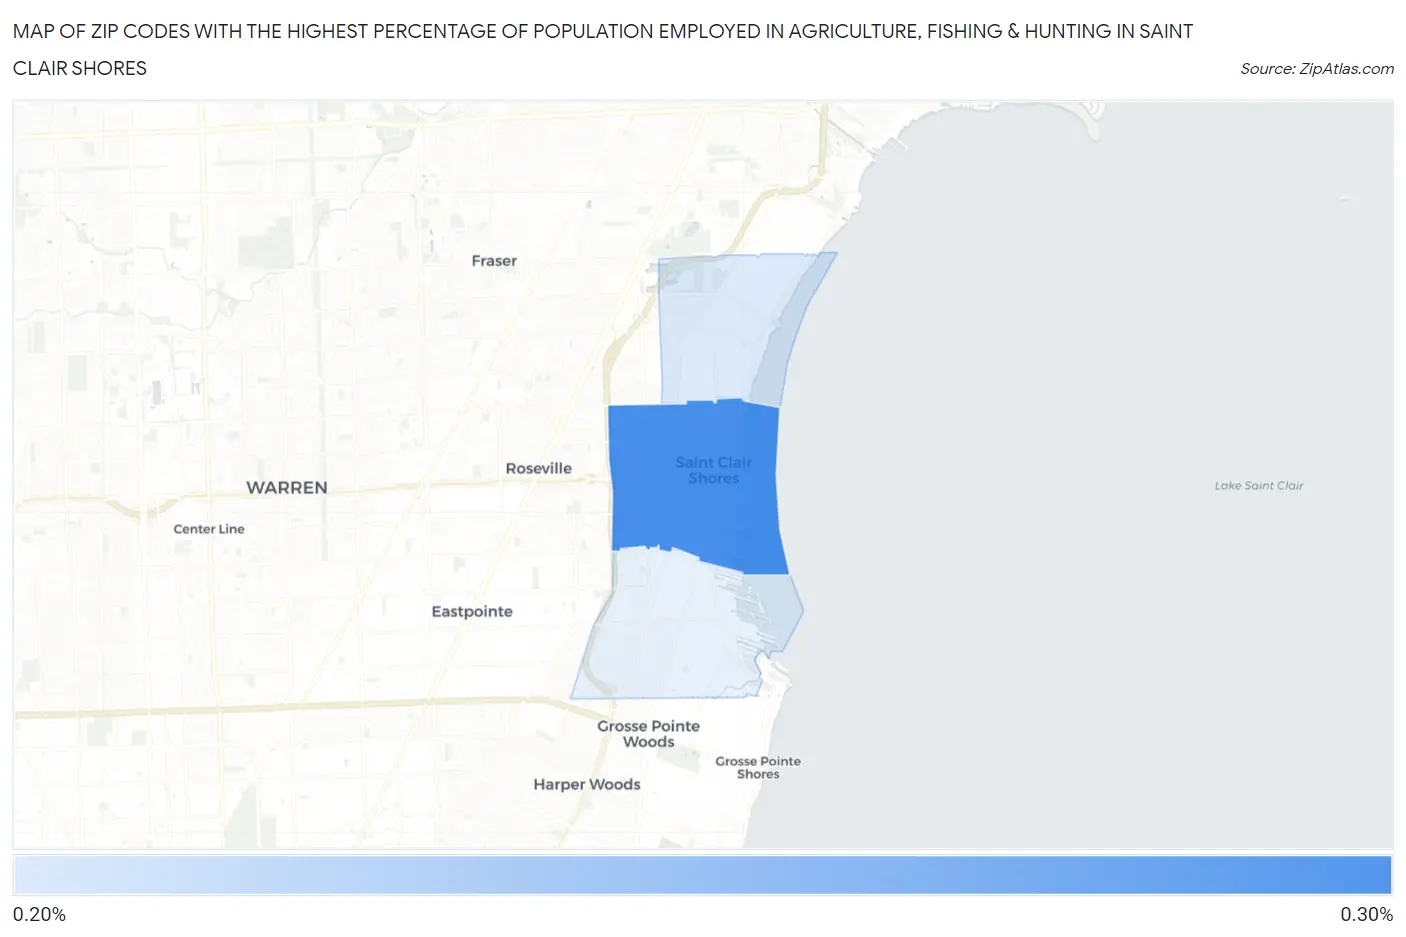
Map of Zip Codes with the Highest Percentage of Population Employed in Agriculture, Fishing & Hunting in Saint Clair Shores
0.0%
0.30%
Zip Codes with the Highest Percentage of Population Employed in Agriculture, Fishing & Hunting in Saint Clair Shores, MI
| Zip Code | % Employed | vs State | vs National | |
| 1. | 48081 | 0.25% | 0.98%(-0.729)#725 | 1.2%(-0.945)#21,716 |
| 2. | 48082 | 0.23% | 0.98%(-0.753)#731 | 1.2%(-0.968)#21,980 |
1
Common Questions
What are the Top Zip Codes with the Highest Percentage of Population Employed in Agriculture, Fishing & Hunting in Saint Clair Shores, MI?
Top Zip Codes with the Highest Percentage of Population Employed in Agriculture, Fishing & Hunting in Saint Clair Shores, MI are:
What zip code has the Highest Percentage of Population Employed in Agriculture, Fishing & Hunting in Saint Clair Shores, MI?
48081 has the Highest Percentage of Population Employed in Agriculture, Fishing & Hunting in Saint Clair Shores, MI with 0.25%.
What is the Percentage of Population Employed in Agriculture, Fishing & Hunting in Michigan?
Percentage of Population Employed in Agriculture, Fishing & Hunting in Michigan is 0.98%.
What is the Percentage of Population Employed in Agriculture, Fishing & Hunting in the United States?
Percentage of Population Employed in Agriculture, Fishing & Hunting in the United States is 1.2%.