Zip Codes with the Highest Percentage of Families with Income Below $10,000 in Muskegon, MI
RELATED REPORTS & OPTIONS
Family Income | $0-10k
Muskegon
Compare Zip Codes
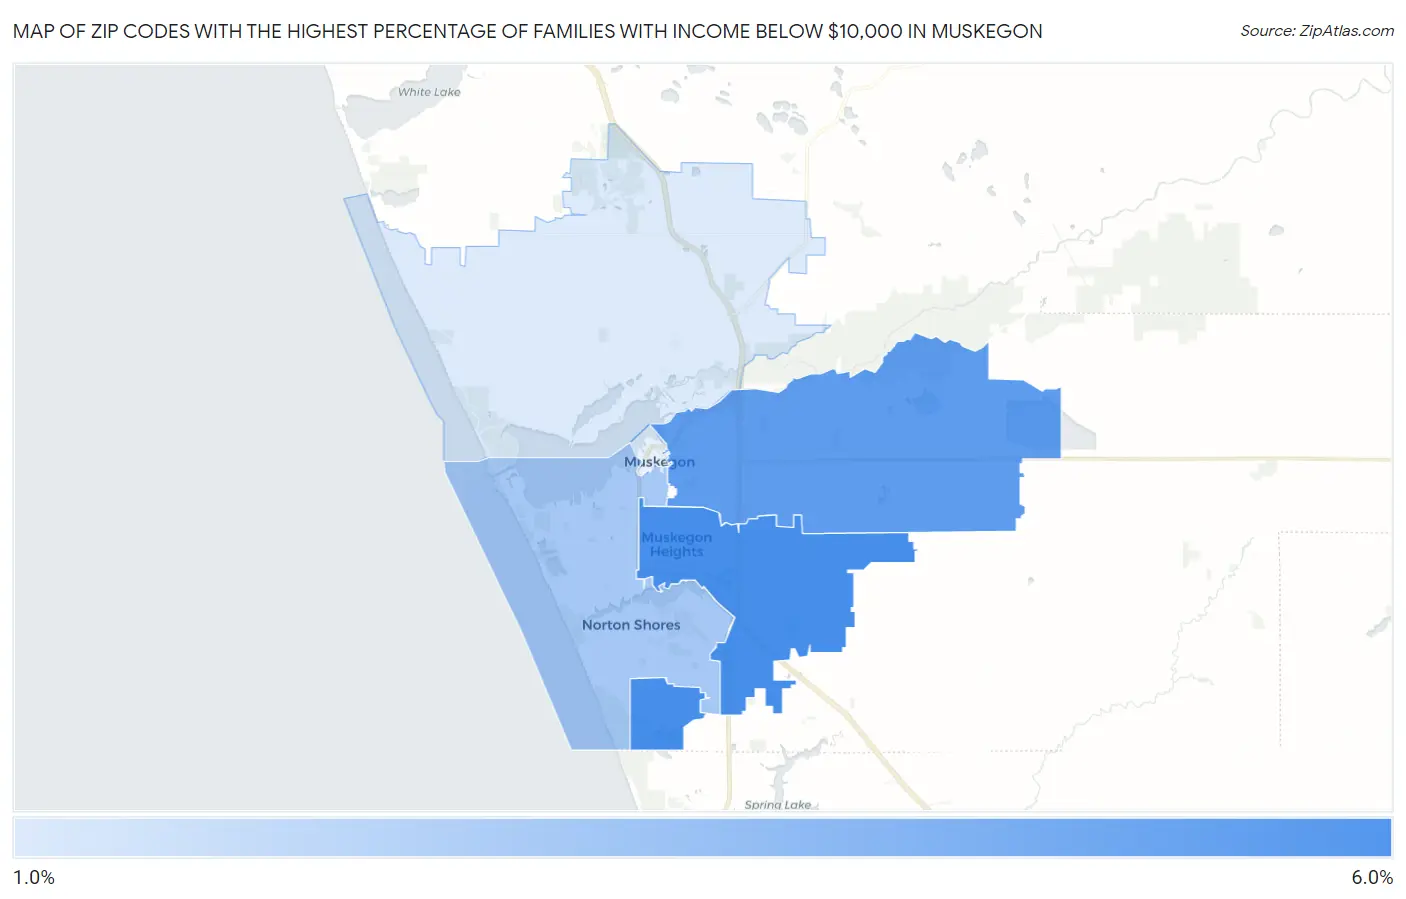
Map of Zip Codes with the Highest Percentage of Families with Income Below $10,000 in Muskegon
0.0%
6.0%
Zip Codes with the Highest Percentage of Families with Income Below $10,000 in Muskegon, MI
| Zip Code | Families with Income < $10k | vs State | vs National | |
| 1. | 49444 | 5.4% | 3.0%(+2.40)#123 | 3.1%(+2.30)#5,456 |
| 2. | 49442 | 4.8% | 3.0%(+1.80)#154 | 3.1%(+1.70)#6,418 |
| 3. | 49441 | 2.9% | 3.0%(-0.100)#328 | 3.1%(-0.200)#11,466 |
| 4. | 49445 | 1.5% | 3.0%(-1.50)#578 | 3.1%(-1.60)#17,791 |
1
Common Questions
What are the Top 3 Zip Codes with the Highest Percentage of Families with Income Below $10,000 in Muskegon, MI?
Top 3 Zip Codes with the Highest Percentage of Families with Income Below $10,000 in Muskegon, MI are:
What zip code has the Highest Percentage of Families with Income Below $10,000 in Muskegon, MI?
49444 has the Highest Percentage of Families with Income Below $10,000 in Muskegon, MI with 5.4%.
What is the Percentage of Families with Income Below $10,000 in Muskegon, MI?
Percentage of Families with Income Below $10,000 in Muskegon is 6.8%.
What is the Percentage of Families with Income Below $10,000 in Michigan?
Percentage of Families with Income Below $10,000 in Michigan is 3.0%.
What is the Percentage of Families with Income Below $10,000 in the United States?
Percentage of Families with Income Below $10,000 in the United States is 3.1%.