Zip Codes with the Highest Percentage of Population Employed in Security & Protection in Farmington, MI
RELATED REPORTS & OPTIONS
Security & Protection
Farmington
Compare Zip Codes
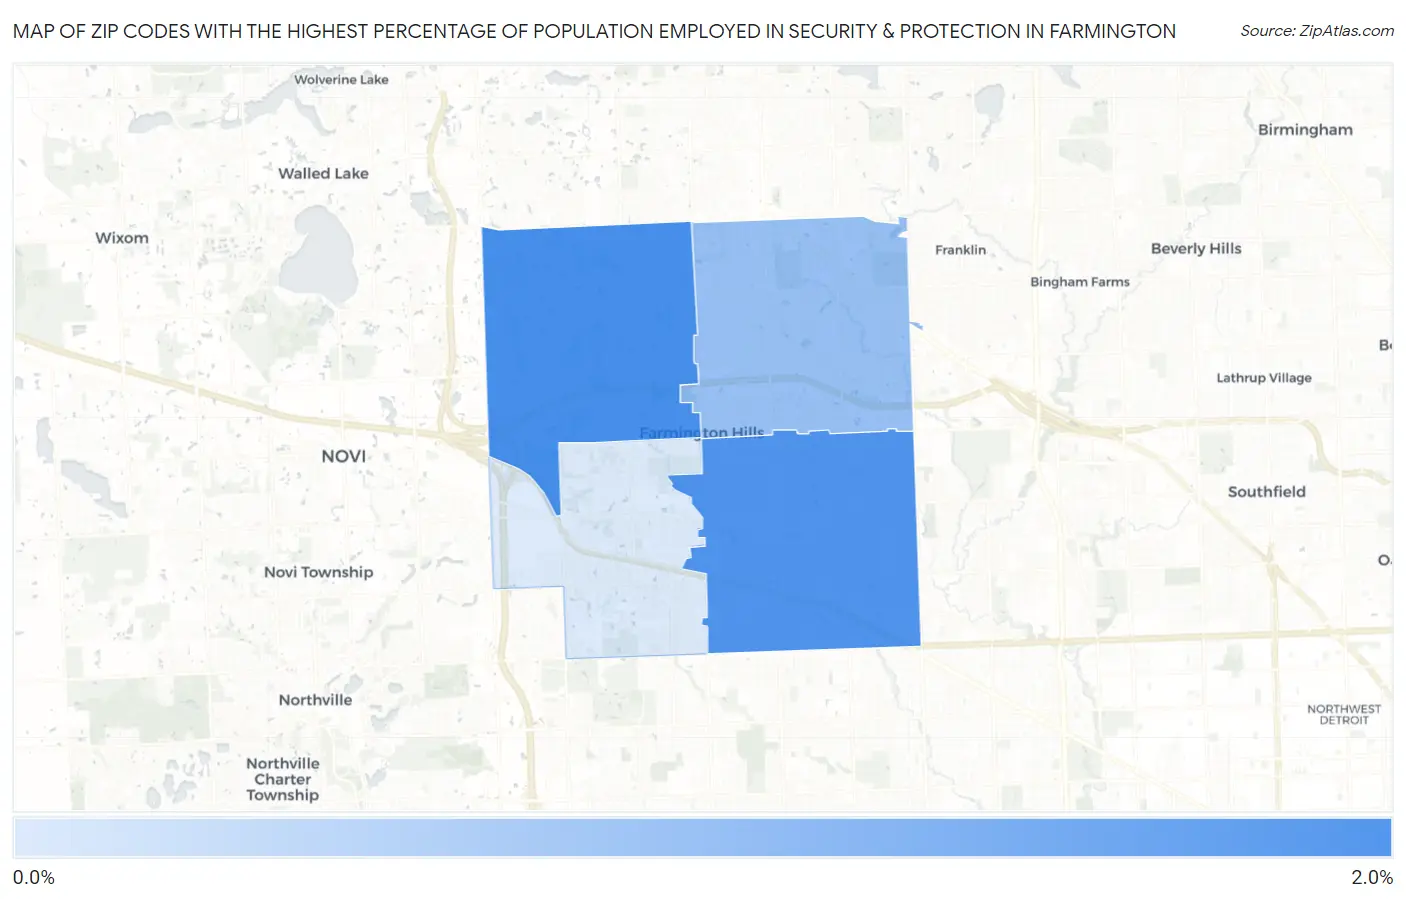
Map of Zip Codes with the Highest Percentage of Population Employed in Security & Protection in Farmington
0.0%
2.0%
Zip Codes with the Highest Percentage of Population Employed in Security & Protection in Farmington, MI
| Zip Code | % Employed | vs State | vs National | |
| 1. | 48331 | 2.0% | 1.6%(+0.321)#298 | 2.1%(-0.186)#12,803 |
| 2. | 48336 | 1.9% | 1.6%(+0.264)#319 | 2.1%(-0.243)#13,179 |
| 3. | 48334 | 1.4% | 1.6%(-0.246)#480 | 2.1%(-0.753)#16,985 |
| 4. | 48335 | 0.91% | 1.6%(-0.733)#651 | 2.1%(-1.24)#20,734 |
1
Common Questions
What are the Top 3 Zip Codes with the Highest Percentage of Population Employed in Security & Protection in Farmington, MI?
Top 3 Zip Codes with the Highest Percentage of Population Employed in Security & Protection in Farmington, MI are:
What zip code has the Highest Percentage of Population Employed in Security & Protection in Farmington, MI?
48331 has the Highest Percentage of Population Employed in Security & Protection in Farmington, MI with 2.0%.
What is the Percentage of Population Employed in Security & Protection in Farmington, MI?
Percentage of Population Employed in Security & Protection in Farmington is 2.5%.
What is the Percentage of Population Employed in Security & Protection in Michigan?
Percentage of Population Employed in Security & Protection in Michigan is 1.6%.
What is the Percentage of Population Employed in Security & Protection in the United States?
Percentage of Population Employed in Security & Protection in the United States is 2.1%.