Immigrants from Sudan vs Immigrants from Kenya In Labor Force | Age 25-29

COMPARE

Immigrants from Sudan
Race
Ancestry
AfghanAfricanAlaska NativeAlaskan AthabascanAlbanianAleutAlsatianAmericanApacheArabArapahoArgentineanArmenianAssyrian/Chaldean/SyriacAustralianAustrianBahamianBangladeshiBarbadianBasqueBelgianBelizeanBermudanBhutaneseBlackfeetBolivianBrazilianBritishBritish West IndianBulgarianBurmeseCajunCambodianCanadianCape VerdeanCarpatho RusynCelticCentral AmericanCentral American IndianCherokeeCheyenneChickasawChileanChineseChippewaChoctawColombianColvilleComancheCosta RicanCreeCreekCroatianCrowCubanCypriotCzechCzechoslovakianDanishDelawareDominicanDutchDutch West IndianEastern EuropeanEcuadorianEgyptianEnglishEstonianEthiopianEuropeanFijianFilipinoFinnishFrenchFrench American IndianFrench CanadianGermanGerman RussianGhanaianGreekGuamanian/ChamorroGuatemalanGuyaneseHaitianHmongHonduranHopiHoumaHungarianIcelanderIndian (Asian)IndonesianInupiatIranianIraqiIrishIroquoisIsraeliItalianJamaicanJapaneseJordanianKenyanKiowaKoreanLaotianLatvianLebaneseLiberianLithuanianLumbeeLuxembourgerMacedonianMalaysianMalteseMarshalleseMenomineeMexicanMexican American IndianMongolianMoroccanNative HawaiianNavajoNepaleseNew ZealanderNicaraguanNigerianNorthern EuropeanNorwegianOkinawanOsageOttawaPaiutePakistaniPalestinianPanamanianParaguayanPennsylvania GermanPeruvianPimaPolishPortuguesePotawatomiPuebloPuerto RicanPuget Sound SalishRomanianRussianSalvadoranSamoanScandinavianScotch-IrishScottishSeminoleSenegaleseSerbianShoshoneSierra LeoneanSiouxSlavicSlovakSloveneSomaliSouth AfricanSouth AmericanSouth American IndianSoviet UnionSpaniardSpanishSpanish AmericanSpanish American IndianSri LankanSubsaharan AfricanSudaneseSwedishSwissSyrianTaiwaneseThaiTlingit-HaidaTohono O'OdhamTonganTrinidadian and TobagonianTsimshianTurkishU.S. Virgin IslanderUgandanUkrainianUruguayanUteVenezuelanVietnameseWelshWest IndianYakamaYaquiYugoslavianYumanYup'ikZimbabwean
Immigration
NonimmigrantsImmigrantsAfghanistanAfricaAlbaniaArgentinaArmeniaAsiaAustraliaAustriaBahamasBangladeshBarbadosBelarusBelgiumBelizeBoliviaBosnia and HerzegovinaBrazilBulgariaBurma/MyanmarCabo VerdeCambodiaCameroonCanadaCaribbeanCentral AmericaChileChinaColombiaCongoCosta RicaCroatiaCubaCzechoslovakiaDenmarkDominicaDominican RepublicEastern AfricaEastern AsiaEastern EuropeEcuadorEgyptEl SalvadorEnglandEritreaEthiopiaEuropeFijiFranceGermanyGhanaGreeceGrenadaGuatemalaGuyanaHaitiHondurasHong KongHungaryIndiaIndonesiaIranIraqIrelandIsraelItalyJamaicaJapanJordanKazakhstanKoreaKuwaitLaosLatin AmericaLatviaLebanonLiberiaLithuaniaMalaysiaMexicoMicronesiaMiddle AfricaMoldovaMoroccoNepalNetherlandsNicaraguaNigeriaNorth AmericaNorth MacedoniaNorthern AfricaNorthern EuropeNorwayOceaniaPakistanPanamaPeruPhilippinesPolandPortugalRomaniaRussiaSaudi ArabiaScotlandSenegalSerbiaSierra LeoneSingaporeSomaliaSouth AfricaSouth AmericaSouth Central AsiaSouth Eastern AsiaSouthern EuropeSpainSri LankaSt. Vincent and the GrenadinesSudanSwedenSwitzerlandSyriaTaiwanThailandTrinidad and TobagoTurkeyUgandaUkraineUruguayUzbekistanVenezuelaVietnamWest IndiesWestern AfricaWestern AsiaWestern EuropeYemenZaireZimbabweAzores
Immigrants from Kenya
Race
Ancestry
AfghanAfricanAlaska NativeAlaskan AthabascanAlbanianAleutAlsatianAmericanApacheArabArapahoArgentineanArmenianAssyrian/Chaldean/SyriacAustralianAustrianBahamianBangladeshiBarbadianBasqueBelgianBelizeanBermudanBhutaneseBlackfeetBolivianBrazilianBritishBritish West IndianBulgarianBurmeseCajunCambodianCanadianCape VerdeanCarpatho RusynCelticCentral AmericanCentral American IndianCherokeeCheyenneChickasawChileanChineseChippewaChoctawColombianColvilleComancheCosta RicanCreeCreekCroatianCrowCubanCypriotCzechCzechoslovakianDanishDelawareDominicanDutchDutch West IndianEastern EuropeanEcuadorianEgyptianEnglishEstonianEthiopianEuropeanFijianFilipinoFinnishFrenchFrench American IndianFrench CanadianGermanGerman RussianGhanaianGreekGuamanian/ChamorroGuatemalanGuyaneseHaitianHmongHonduranHopiHoumaHungarianIcelanderIndian (Asian)IndonesianInupiatIranianIraqiIrishIroquoisIsraeliItalianJamaicanJapaneseJordanianKenyanKiowaKoreanLaotianLatvianLebaneseLiberianLithuanianLumbeeLuxembourgerMacedonianMalaysianMalteseMarshalleseMenomineeMexicanMexican American IndianMongolianMoroccanNative HawaiianNavajoNepaleseNew ZealanderNicaraguanNigerianNorthern EuropeanNorwegianOkinawanOsageOttawaPaiutePakistaniPalestinianPanamanianParaguayanPennsylvania GermanPeruvianPimaPolishPortuguesePotawatomiPuebloPuerto RicanPuget Sound SalishRomanianRussianSalvadoranSamoanScandinavianScotch-IrishScottishSeminoleSenegaleseSerbianShoshoneSierra LeoneanSiouxSlavicSlovakSloveneSomaliSouth AfricanSouth AmericanSouth American IndianSoviet UnionSpaniardSpanishSpanish AmericanSpanish American IndianSri LankanSubsaharan AfricanSudaneseSwedishSwissSyrianTaiwaneseThaiTlingit-HaidaTohono O'OdhamTonganTrinidadian and TobagonianTsimshianTurkishU.S. Virgin IslanderUgandanUkrainianUruguayanUteVenezuelanVietnameseWelshWest IndianYakamaYaquiYugoslavianYumanYup'ikZimbabwean
Immigration
NonimmigrantsImmigrantsAfghanistanAfricaAlbaniaArgentinaArmeniaAsiaAustraliaAustriaBahamasBangladeshBarbadosBelarusBelgiumBelizeBoliviaBosnia and HerzegovinaBrazilBulgariaBurma/MyanmarCabo VerdeCambodiaCameroonCanadaCaribbeanCentral AmericaChileChinaColombiaCongoCosta RicaCroatiaCubaCzechoslovakiaDenmarkDominicaDominican RepublicEastern AfricaEastern AsiaEastern EuropeEcuadorEgyptEl SalvadorEnglandEritreaEthiopiaEuropeFijiFranceGermanyGhanaGreeceGrenadaGuatemalaGuyanaHaitiHondurasHong KongHungaryIndiaIndonesiaIranIraqIrelandIsraelItalyJamaicaJapanJordanKazakhstanKenyaKoreaKuwaitLaosLatin AmericaLatviaLebanonLiberiaLithuaniaMalaysiaMexicoMicronesiaMiddle AfricaMoldovaMoroccoNepalNetherlandsNicaraguaNigeriaNorth AmericaNorth MacedoniaNorthern AfricaNorthern EuropeNorwayOceaniaPakistanPanamaPeruPhilippinesPolandPortugalRomaniaRussiaSaudi ArabiaScotlandSenegalSerbiaSierra LeoneSingaporeSomaliaSouth AfricaSouth AmericaSouth Central AsiaSouth Eastern AsiaSouthern EuropeSpainSri LankaSt. Vincent and the GrenadinesSwedenSwitzerlandSyriaTaiwanThailandTrinidad and TobagoTurkeyUgandaUkraineUruguayUzbekistanVenezuelaVietnamWest IndiesWestern AfricaWestern AsiaWestern EuropeYemenZaireZimbabweAzores
In Labor Force | Age 25-29
Income
Poverty
Unemployment
Labor Participation
Family Structure
Vehicle Availability
Education Level
Disability

In Labor Force | Age 25-29 Comparison

Immigrants from Sudan

Immigrants from Kenya

Exceptional
Exceptional
85.1%
IN LABOR FORCE | AGE 25-29
94.3/ 100
METRIC RATING
97th/ 347
METRIC RANK
85.4%
IN LABOR FORCE | AGE 25-29
99.4/ 100
METRIC RATING
63rd/ 347
METRIC RANK

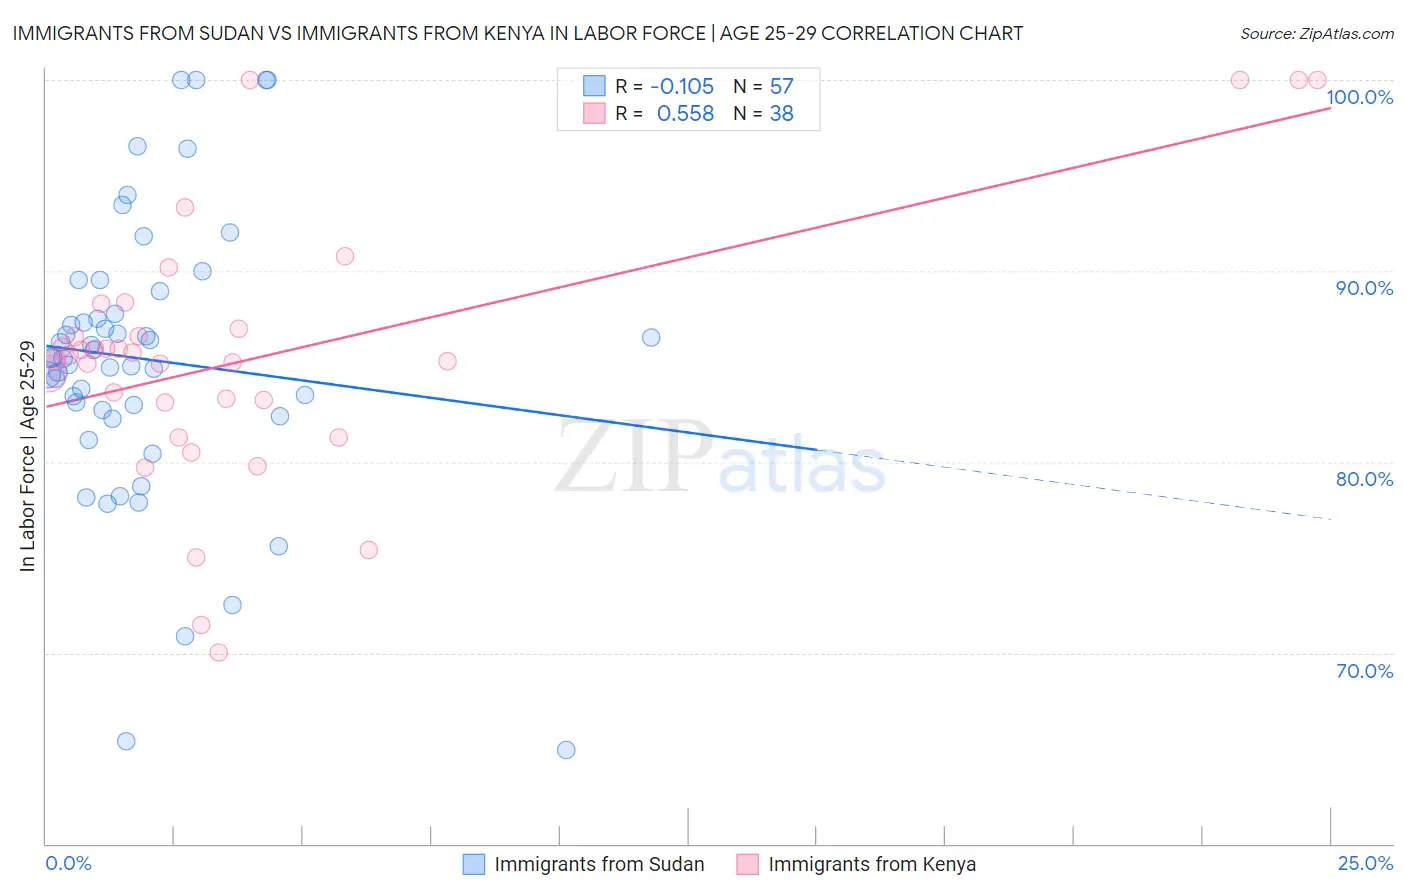
Immigrants from Sudan vs Immigrants from Kenya In Labor Force | Age 25-29 Correlation Chart

The statistical analysis conducted on geographies consisting of 118,966,602 people shows a poor negative correlation between the proportion of Immigrants from Sudan and labor force participation rate among population between the ages 25 and 29 in the United States with a correlation coefficient (R) of -0.105 and weighted average of 85.1%. Similarly, the statistical analysis conducted on geographies consisting of 218,069,708 people shows a substantial positive correlation between the proportion of Immigrants from Kenya and labor force participation rate among population between the ages 25 and 29 in the United States with a correlation coefficient (R) of 0.558 and weighted average of 85.4%, a difference of 0.42%.
Immigrants from Sudan vs Immigrants from Kenya In Labor Force | Age 25-29

In Labor Force | Age 25-29 Correlation Summary

MeasurementImmigrants from SudanImmigrants from Kenya
Minimum64.9%70.0%
Maximum100.0%100.0%
Range35.1%30.0%
Mean85.4%85.5%
Median85.5%85.5%
Interquartile 25% (IQ1)82.6%83.1%
Interquartile 75% (IQ3)88.3%87.0%
Interquartile Range (IQR)5.8%3.9%
Standard Deviation (Sample)7.4%6.9%
Standard Deviation (Population)7.3%6.8%

Similar Demographics by In Labor Force | Age 25-29

Demographics Similar to Immigrants from Sudan by In Labor Force | Age 25-29

In terms of in labor force | age 25-29, the demographic groups most similar to Immigrants from Sudan are Immigrants from Netherlands (85.1%, a difference of 0.010%), Immigrants from Romania (85.1%, a difference of 0.010%), Mongolian (85.1%, a difference of 0.010%), Bangladeshi (85.1%, a difference of 0.010%), and Immigrants from Switzerland (85.1%, a difference of 0.010%).
DemographicsRating | RankIn Labor Force | Age 25-29
Burmese
95.9
/100
|
#90
Exceptional
85.1%
Immigrants | Moldova
95.8
/100
|
#91
Exceptional
85.1%
Immigrants | Costa Rica
95.5
/100
|
#92
Exceptional
85.1%
Austrians
95.3
/100
|
#93
Exceptional
85.1%
Immigrants | Korea
94.8
/100
|
#94
Exceptional
85.1%
Immigrants | Netherlands
94.6
/100
|
#95
Exceptional
85.1%
Immigrants | Romania
94.6
/100
|
#96
Exceptional
85.1%
Immigrants | Sudan
94.3
/100
|
#97
Exceptional
85.1%
Mongolians
94.1
/100
|
#98
Exceptional
85.1%
Bangladeshis
94.0
/100
|
#99
Exceptional
85.1%
Immigrants | Switzerland
93.9
/100
|
#100
Exceptional
85.1%
Egyptians
93.8
/100
|
#101
Exceptional
85.1%
Slavs
93.7
/100
|
#102
Exceptional
85.1%
Immigrants | Japan
93.5
/100
|
#103
Exceptional
85.1%
Immigrants | Zaire
93.3
/100
|
#104
Exceptional
85.1%

Demographics Similar to Immigrants from Kenya by In Labor Force | Age 25-29

In terms of in labor force | age 25-29, the demographic groups most similar to Immigrants from Kenya are Taiwanese (85.4%, a difference of 0.010%), Thai (85.5%, a difference of 0.020%), Serbian (85.5%, a difference of 0.020%), Immigrants from Italy (85.4%, a difference of 0.020%), and Immigrants from Czechoslovakia (85.4%, a difference of 0.030%).
DemographicsRating | RankIn Labor Force | Age 25-29
Eastern Europeans
99.6
/100
|
#56
Exceptional
85.5%
Estonians
99.6
/100
|
#57
Exceptional
85.5%
Greeks
99.6
/100
|
#58
Exceptional
85.5%
Immigrants | Morocco
99.5
/100
|
#59
Exceptional
85.5%
Thais
99.5
/100
|
#60
Exceptional
85.5%
Serbians
99.5
/100
|
#61
Exceptional
85.5%
Taiwanese
99.4
/100
|
#62
Exceptional
85.4%
Immigrants | Kenya
99.4
/100
|
#63
Exceptional
85.4%
Immigrants | Italy
99.3
/100
|
#64
Exceptional
85.4%
Immigrants | Czechoslovakia
99.3
/100
|
#65
Exceptional
85.4%
Immigrants | Scotland
99.3
/100
|
#66
Exceptional
85.4%
Immigrants | Turkey
99.2
/100
|
#67
Exceptional
85.4%
Immigrants | Cameroon
99.2
/100
|
#68
Exceptional
85.4%
Menominee
99.1
/100
|
#69
Exceptional
85.4%
Immigrants | Sweden
99.1
/100
|
#70
Exceptional
85.4%