Immigrants from St. Vincent and the Grenadines vs Immigrants from China In Labor Force | Age 20-64
COMPARE
Immigrants from St. Vincent and the Grenadines
Immigrants from China
In Labor Force | Age 20-64
In Labor Force | Age 20-64 Comparison
Immigrants from St. Vincent and the Grenadines
Immigrants from China
78.1%
IN LABOR FORCE | AGE 20-64
0.0/ 100
METRIC RATING
282nd/ 347
METRIC RANK
79.7%
IN LABOR FORCE | AGE 20-64
69.1/ 100
METRIC RATING
157th/ 347
METRIC RANK
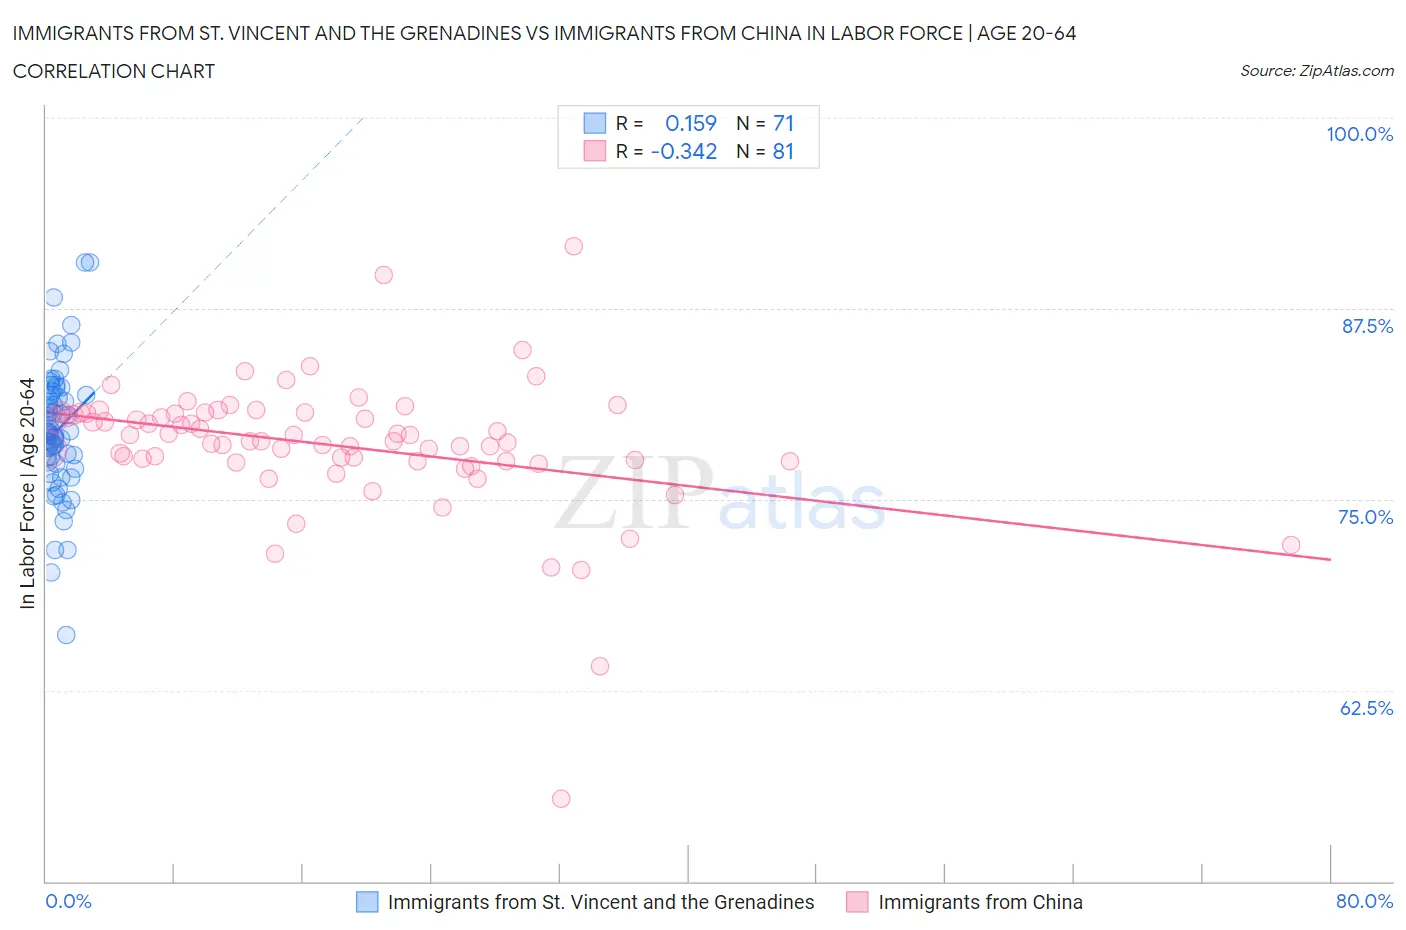
Immigrants from St. Vincent and the Grenadines vs Immigrants from China In Labor Force | Age 20-64 Correlation Chart
The statistical analysis conducted on geographies consisting of 56,193,852 people shows a poor positive correlation between the proportion of Immigrants from St. Vincent and the Grenadines and labor force participation rate among population between the ages 20 and 64 in the United States with a correlation coefficient (R) of 0.159 and weighted average of 78.1%. Similarly, the statistical analysis conducted on geographies consisting of 457,119,637 people shows a mild negative correlation between the proportion of Immigrants from China and labor force participation rate among population between the ages 20 and 64 in the United States with a correlation coefficient (R) of -0.342 and weighted average of 79.7%, a difference of 2.1%.
In Labor Force | Age 20-64 Correlation Summary
| Measurement | Immigrants from St. Vincent and the Grenadines | Immigrants from China |
| Minimum | 66.1% | 55.4% |
| Maximum | 90.5% | 91.6% |
| Range | 24.4% | 36.2% |
| Mean | 79.6% | 78.6% |
| Median | 79.4% | 78.8% |
| Interquartile 25% (IQ1) | 77.4% | 77.5% |
| Interquartile 75% (IQ3) | 81.9% | 80.7% |
| Interquartile Range (IQR) | 4.4% | 3.2% |
| Standard Deviation (Sample) | 4.2% | 4.5% |
| Standard Deviation (Population) | 4.2% | 4.5% |
Similar Demographics by In Labor Force | Age 20-64
Demographics Similar to Immigrants from St. Vincent and the Grenadines by In Labor Force | Age 20-64
In terms of in labor force | age 20-64, the demographic groups most similar to Immigrants from St. Vincent and the Grenadines are Nonimmigrants (78.1%, a difference of 0.010%), Guyanese (78.1%, a difference of 0.020%), Immigrants from Guyana (78.1%, a difference of 0.030%), Immigrants from Dominica (78.1%, a difference of 0.050%), and Belizean (78.2%, a difference of 0.090%).
| Demographics | Rating | Rank | In Labor Force | Age 20-64 |
| Spanish | 0.0 /100 | #275 | Tragic 78.2% |
| Puget Sound Salish | 0.0 /100 | #276 | Tragic 78.2% |
| Immigrants | Bahamas | 0.0 /100 | #277 | Tragic 78.2% |
| Mexican American Indians | 0.0 /100 | #278 | Tragic 78.2% |
| Belizeans | 0.0 /100 | #279 | Tragic 78.2% |
| Immigrants | Dominica | 0.0 /100 | #280 | Tragic 78.1% |
| Guyanese | 0.0 /100 | #281 | Tragic 78.1% |
| Immigrants | St. Vincent and the Grenadines | 0.0 /100 | #282 | Tragic 78.1% |
| Immigrants | Nonimmigrants | 0.0 /100 | #283 | Tragic 78.1% |
| Immigrants | Guyana | 0.0 /100 | #284 | Tragic 78.1% |
| Osage | 0.0 /100 | #285 | Tragic 78.0% |
| Immigrants | Belize | 0.0 /100 | #286 | Tragic 78.0% |
| Vietnamese | 0.0 /100 | #287 | Tragic 78.0% |
| Hmong | 0.0 /100 | #288 | Tragic 77.9% |
| Africans | 0.0 /100 | #289 | Tragic 77.9% |
Demographics Similar to Immigrants from China by In Labor Force | Age 20-64
In terms of in labor force | age 20-64, the demographic groups most similar to Immigrants from China are Immigrants from Kazakhstan (79.7%, a difference of 0.0%), New Zealander (79.7%, a difference of 0.0%), Immigrants from South Africa (79.7%, a difference of 0.0%), Senegalese (79.7%, a difference of 0.0%), and Austrian (79.7%, a difference of 0.010%).
| Demographics | Rating | Rank | In Labor Force | Age 20-64 |
| Costa Ricans | 72.4 /100 | #150 | Good 79.7% |
| Scandinavians | 72.0 /100 | #151 | Good 79.7% |
| Immigrants | Northern Europe | 72.0 /100 | #152 | Good 79.7% |
| Immigrants | Kazakhstan | 69.5 /100 | #153 | Good 79.7% |
| New Zealanders | 69.4 /100 | #154 | Good 79.7% |
| Immigrants | South Africa | 69.2 /100 | #155 | Good 79.7% |
| Senegalese | 69.1 /100 | #156 | Good 79.7% |
| Immigrants | China | 69.1 /100 | #157 | Good 79.7% |
| Austrians | 67.6 /100 | #158 | Good 79.7% |
| Immigrants | Cuba | 66.7 /100 | #159 | Good 79.7% |
| Moroccans | 66.7 /100 | #160 | Good 79.7% |
| South Africans | 66.2 /100 | #161 | Good 79.7% |
| Germans | 65.2 /100 | #162 | Good 79.7% |
| Immigrants | Costa Rica | 64.6 /100 | #163 | Good 79.7% |
| Immigrants | Burma/Myanmar | 64.4 /100 | #164 | Good 79.7% |