Immigrants from Caribbean vs Immigrants from China In Labor Force | Age 20-64

COMPARE

Immigrants from Caribbean
Race
Ancestry
AfghanAfricanAlaska NativeAlaskan AthabascanAlbanianAleutAlsatianAmericanApacheArabArapahoArgentineanArmenianAssyrian/Chaldean/SyriacAustralianAustrianBahamianBangladeshiBarbadianBasqueBelgianBelizeanBermudanBhutaneseBlackfeetBolivianBrazilianBritishBritish West IndianBulgarianBurmeseCajunCambodianCanadianCape VerdeanCarpatho RusynCelticCentral AmericanCentral American IndianCherokeeCheyenneChickasawChileanChineseChippewaChoctawColombianColvilleComancheCosta RicanCreeCreekCroatianCrowCubanCypriotCzechCzechoslovakianDanishDelawareDominicanDutchDutch West IndianEastern EuropeanEcuadorianEgyptianEnglishEstonianEthiopianEuropeanFijianFilipinoFinnishFrenchFrench American IndianFrench CanadianGermanGerman RussianGhanaianGreekGuamanian/ChamorroGuatemalanGuyaneseHaitianHmongHonduranHopiHoumaHungarianIcelanderIndian (Asian)IndonesianInupiatIranianIraqiIrishIroquoisIsraeliItalianJamaicanJapaneseJordanianKenyanKiowaKoreanLaotianLatvianLebaneseLiberianLithuanianLumbeeLuxembourgerMacedonianMalaysianMalteseMarshalleseMenomineeMexicanMexican American IndianMongolianMoroccanNative HawaiianNavajoNepaleseNew ZealanderNicaraguanNigerianNorthern EuropeanNorwegianOkinawanOsageOttawaPaiutePakistaniPalestinianPanamanianParaguayanPennsylvania GermanPeruvianPimaPolishPortuguesePotawatomiPuebloPuerto RicanPuget Sound SalishRomanianRussianSalvadoranSamoanScandinavianScotch-IrishScottishSeminoleSenegaleseSerbianShoshoneSierra LeoneanSiouxSlavicSlovakSloveneSomaliSouth AfricanSouth AmericanSouth American IndianSoviet UnionSpaniardSpanishSpanish AmericanSpanish American IndianSri LankanSubsaharan AfricanSudaneseSwedishSwissSyrianTaiwaneseThaiTlingit-HaidaTohono O'OdhamTonganTrinidadian and TobagonianTsimshianTurkishU.S. Virgin IslanderUgandanUkrainianUruguayanUteVenezuelanVietnameseWelshWest IndianYakamaYaquiYugoslavianYumanYup'ikZimbabwean
Immigration
NonimmigrantsImmigrantsAfghanistanAfricaAlbaniaArgentinaArmeniaAsiaAustraliaAustriaBahamasBangladeshBarbadosBelarusBelgiumBelizeBoliviaBosnia and HerzegovinaBrazilBulgariaBurma/MyanmarCabo VerdeCambodiaCameroonCanadaCaribbeanCentral AmericaChileColombiaCongoCosta RicaCroatiaCubaCzechoslovakiaDenmarkDominicaDominican RepublicEastern AfricaEastern AsiaEastern EuropeEcuadorEgyptEl SalvadorEnglandEritreaEthiopiaEuropeFijiFranceGermanyGhanaGreeceGrenadaGuatemalaGuyanaHaitiHondurasHong KongHungaryIndiaIndonesiaIranIraqIrelandIsraelItalyJamaicaJapanJordanKazakhstanKenyaKoreaKuwaitLaosLatin AmericaLatviaLebanonLiberiaLithuaniaMalaysiaMexicoMicronesiaMiddle AfricaMoldovaMoroccoNepalNetherlandsNicaraguaNigeriaNorth AmericaNorth MacedoniaNorthern AfricaNorthern EuropeNorwayOceaniaPakistanPanamaPeruPhilippinesPolandPortugalRomaniaRussiaSaudi ArabiaScotlandSenegalSerbiaSierra LeoneSingaporeSomaliaSouth AfricaSouth AmericaSouth Central AsiaSouth Eastern AsiaSouthern EuropeSpainSri LankaSt. Vincent and the GrenadinesSudanSwedenSwitzerlandSyriaTaiwanThailandTrinidad and TobagoTurkeyUgandaUkraineUruguayUzbekistanVenezuelaVietnamWest IndiesWestern AfricaWestern AsiaWestern EuropeYemenZaireZimbabweAzores
Immigrants from China
Race
Ancestry
AfghanAfricanAlaska NativeAlaskan AthabascanAlbanianAleutAlsatianAmericanApacheArabArapahoArgentineanArmenianAssyrian/Chaldean/SyriacAustralianAustrianBahamianBangladeshiBarbadianBasqueBelgianBelizeanBermudanBhutaneseBlackfeetBolivianBrazilianBritishBritish West IndianBulgarianBurmeseCajunCambodianCanadianCape VerdeanCarpatho RusynCelticCentral AmericanCentral American IndianCherokeeCheyenneChickasawChileanChineseChippewaChoctawColombianColvilleComancheCosta RicanCreeCreekCroatianCrowCubanCypriotCzechCzechoslovakianDanishDelawareDominicanDutchDutch West IndianEastern EuropeanEcuadorianEgyptianEnglishEstonianEthiopianEuropeanFijianFilipinoFinnishFrenchFrench American IndianFrench CanadianGermanGerman RussianGhanaianGreekGuamanian/ChamorroGuatemalanGuyaneseHaitianHmongHonduranHopiHoumaHungarianIcelanderIndian (Asian)IndonesianInupiatIranianIraqiIrishIroquoisIsraeliItalianJamaicanJapaneseJordanianKenyanKiowaKoreanLaotianLatvianLebaneseLiberianLithuanianLumbeeLuxembourgerMacedonianMalaysianMalteseMarshalleseMenomineeMexicanMexican American IndianMongolianMoroccanNative HawaiianNavajoNepaleseNew ZealanderNicaraguanNigerianNorthern EuropeanNorwegianOkinawanOsageOttawaPaiutePakistaniPalestinianPanamanianParaguayanPennsylvania GermanPeruvianPimaPolishPortuguesePotawatomiPuebloPuerto RicanPuget Sound SalishRomanianRussianSalvadoranSamoanScandinavianScotch-IrishScottishSeminoleSenegaleseSerbianShoshoneSierra LeoneanSiouxSlavicSlovakSloveneSomaliSouth AfricanSouth AmericanSouth American IndianSoviet UnionSpaniardSpanishSpanish AmericanSpanish American IndianSri LankanSubsaharan AfricanSudaneseSwedishSwissSyrianTaiwaneseThaiTlingit-HaidaTohono O'OdhamTonganTrinidadian and TobagonianTsimshianTurkishU.S. Virgin IslanderUgandanUkrainianUruguayanUteVenezuelanVietnameseWelshWest IndianYakamaYaquiYugoslavianYumanYup'ikZimbabwean
Immigration
NonimmigrantsImmigrantsAfghanistanAfricaAlbaniaArgentinaArmeniaAsiaAustraliaAustriaBahamasBangladeshBarbadosBelarusBelgiumBelizeBoliviaBosnia and HerzegovinaBrazilBulgariaBurma/MyanmarCabo VerdeCambodiaCameroonCanadaCentral AmericaChileChinaColombiaCongoCosta RicaCroatiaCubaCzechoslovakiaDenmarkDominicaDominican RepublicEastern AfricaEastern AsiaEastern EuropeEcuadorEgyptEl SalvadorEnglandEritreaEthiopiaEuropeFijiFranceGermanyGhanaGreeceGrenadaGuatemalaGuyanaHaitiHondurasHong KongHungaryIndiaIndonesiaIranIraqIrelandIsraelItalyJamaicaJapanJordanKazakhstanKenyaKoreaKuwaitLaosLatin AmericaLatviaLebanonLiberiaLithuaniaMalaysiaMexicoMicronesiaMiddle AfricaMoldovaMoroccoNepalNetherlandsNicaraguaNigeriaNorth AmericaNorth MacedoniaNorthern AfricaNorthern EuropeNorwayOceaniaPakistanPanamaPeruPhilippinesPolandPortugalRomaniaRussiaSaudi ArabiaScotlandSenegalSerbiaSierra LeoneSingaporeSomaliaSouth AfricaSouth AmericaSouth Central AsiaSouth Eastern AsiaSouthern EuropeSpainSri LankaSt. Vincent and the GrenadinesSudanSwedenSwitzerlandSyriaTaiwanThailandTrinidad and TobagoTurkeyUgandaUkraineUruguayUzbekistanVenezuelaVietnamWest IndiesWestern AfricaWestern AsiaWestern EuropeYemenZaireZimbabweAzores
In Labor Force | Age 20-64
Income
Poverty
Unemployment
Labor Participation
Family Structure
Vehicle Availability
Education Level
Disability

In Labor Force | Age 20-64 Comparison

Immigrants from Caribbean

Immigrants from China

Tragic
Good
78.8%
IN LABOR FORCE | AGE 20-64
1.0/ 100
METRIC RATING
248th/ 347
METRIC RANK
79.7%
IN LABOR FORCE | AGE 20-64
69.1/ 100
METRIC RATING
157th/ 347
METRIC RANK

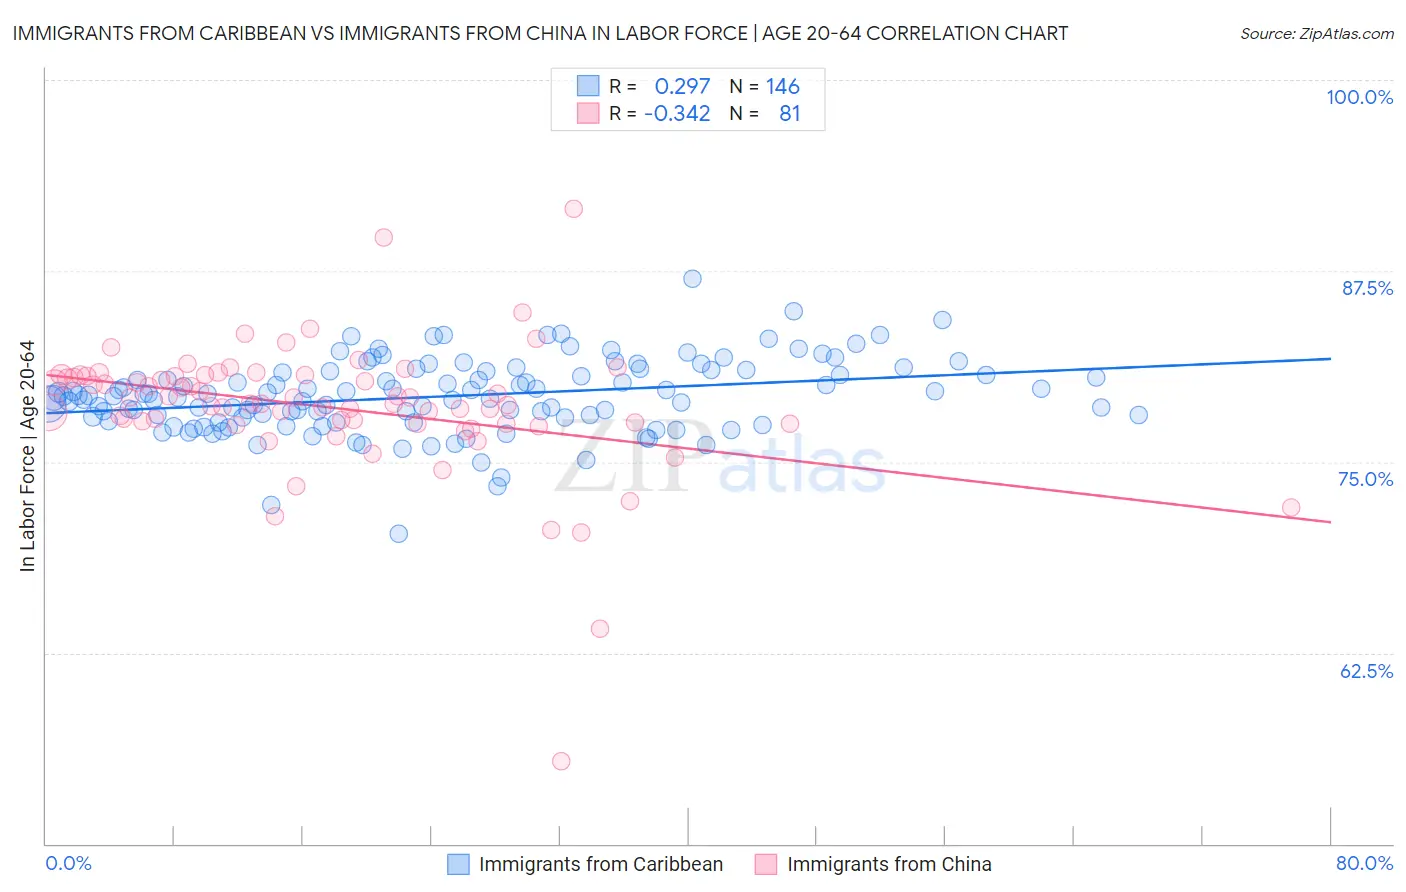
Immigrants from Caribbean vs Immigrants from China In Labor Force | Age 20-64 Correlation Chart

The statistical analysis conducted on geographies consisting of 450,041,805 people shows a weak positive correlation between the proportion of Immigrants from Caribbean and labor force participation rate among population between the ages 20 and 64 in the United States with a correlation coefficient (R) of 0.297 and weighted average of 78.8%. Similarly, the statistical analysis conducted on geographies consisting of 457,119,637 people shows a mild negative correlation between the proportion of Immigrants from China and labor force participation rate among population between the ages 20 and 64 in the United States with a correlation coefficient (R) of -0.342 and weighted average of 79.7%, a difference of 1.1%.
Immigrants from Caribbean vs Immigrants from China In Labor Force | Age 20-64

In Labor Force | Age 20-64 Correlation Summary

MeasurementImmigrants from CaribbeanImmigrants from China
Minimum70.3%55.4%
Maximum87.0%91.6%
Range16.7%36.2%
Mean79.3%78.6%
Median79.3%78.8%
Interquartile 25% (IQ1)77.9%77.5%
Interquartile 75% (IQ3)80.9%80.7%
Interquartile Range (IQR)3.0%3.2%
Standard Deviation (Sample)2.4%4.5%
Standard Deviation (Population)2.4%4.5%

Similar Demographics by In Labor Force | Age 20-64

Demographics Similar to Immigrants from Caribbean by In Labor Force | Age 20-64

In terms of in labor force | age 20-64, the demographic groups most similar to Immigrants from Caribbean are Immigrants from Germany (78.8%, a difference of 0.010%), Immigrants from Trinidad and Tobago (78.8%, a difference of 0.020%), English (78.8%, a difference of 0.030%), Honduran (78.8%, a difference of 0.030%), and Scottish (78.9%, a difference of 0.050%).
DemographicsRating | RankIn Labor Force | Age 20-64
Jamaicans
2.0
/100
|
#241
Tragic
78.9%
Immigrants | Micronesia
1.9
/100
|
#242
Tragic
78.9%
Immigrants | West Indies
1.7
/100
|
#243
Tragic
78.9%
French
1.5
/100
|
#244
Tragic
78.9%
Scottish
1.3
/100
|
#245
Tragic
78.9%
Immigrants | Trinidad and Tobago
1.1
/100
|
#246
Tragic
78.8%
Immigrants | Germany
1.0
/100
|
#247
Tragic
78.8%
Immigrants | Caribbean
1.0
/100
|
#248
Tragic
78.8%
English
0.9
/100
|
#249
Tragic
78.8%
Hondurans
0.8
/100
|
#250
Tragic
78.8%
Barbadians
0.7
/100
|
#251
Tragic
78.8%
Immigrants | Honduras
0.6
/100
|
#252
Tragic
78.7%
Basques
0.5
/100
|
#253
Tragic
78.7%
Immigrants | Lebanon
0.5
/100
|
#254
Tragic
78.7%
Hawaiians
0.5
/100
|
#255
Tragic
78.7%

Demographics Similar to Immigrants from China by In Labor Force | Age 20-64

In terms of in labor force | age 20-64, the demographic groups most similar to Immigrants from China are Immigrants from Kazakhstan (79.7%, a difference of 0.0%), New Zealander (79.7%, a difference of 0.0%), Immigrants from South Africa (79.7%, a difference of 0.0%), Senegalese (79.7%, a difference of 0.0%), and Austrian (79.7%, a difference of 0.010%).
DemographicsRating | RankIn Labor Force | Age 20-64
Costa Ricans
72.4
/100
|
#150
Good
79.7%
Scandinavians
72.0
/100
|
#151
Good
79.7%
Immigrants | Northern Europe
72.0
/100
|
#152
Good
79.7%
Immigrants | Kazakhstan
69.5
/100
|
#153
Good
79.7%
New Zealanders
69.4
/100
|
#154
Good
79.7%
Immigrants | South Africa
69.2
/100
|
#155
Good
79.7%
Senegalese
69.1
/100
|
#156
Good
79.7%
Immigrants | China
69.1
/100
|
#157
Good
79.7%
Austrians
67.6
/100
|
#158
Good
79.7%
Immigrants | Cuba
66.7
/100
|
#159
Good
79.7%
Moroccans
66.7
/100
|
#160
Good
79.7%
South Africans
66.2
/100
|
#161
Good
79.7%
Germans
65.2
/100
|
#162
Good
79.7%
Immigrants | Costa Rica
64.6
/100
|
#163
Good
79.7%
Immigrants | Burma/Myanmar
64.4
/100
|
#164
Good
79.7%