Immigrants from India vs Immigrants from Yemen In Labor Force | Age 16-19
COMPARE
Immigrants from India
Immigrants from Yemen
In Labor Force | Age 16-19
In Labor Force | Age 16-19 Comparison
Immigrants from India
Immigrants from Yemen
35.0%
IN LABOR FORCE | AGE 16-19
3.5/ 100
METRIC RATING
237th/ 347
METRIC RANK
31.5%
IN LABOR FORCE | AGE 16-19
0.0/ 100
METRIC RATING
318th/ 347
METRIC RANK
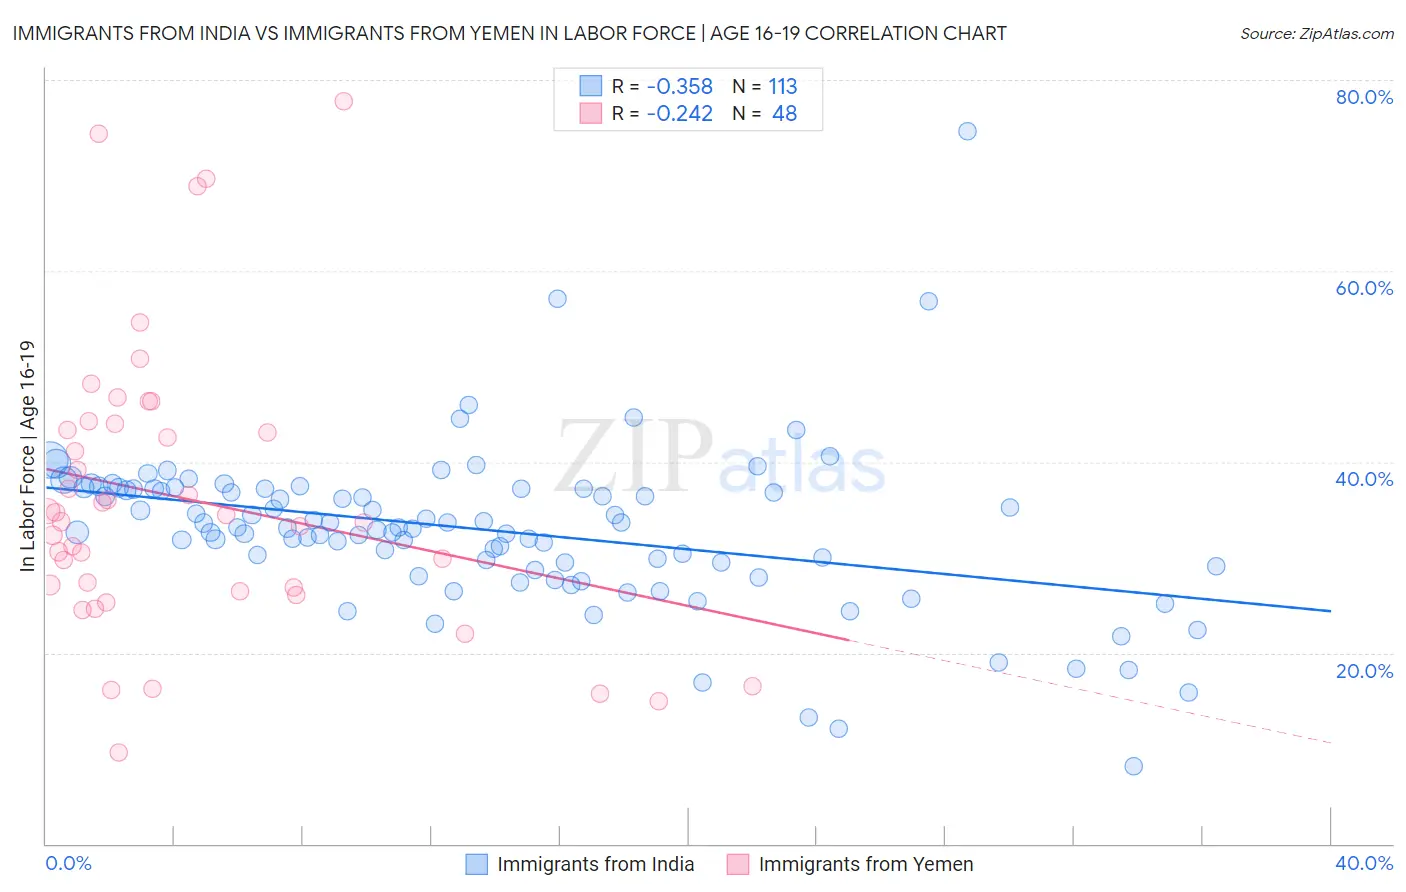
Immigrants from India vs Immigrants from Yemen In Labor Force | Age 16-19 Correlation Chart
The statistical analysis conducted on geographies consisting of 433,366,164 people shows a mild negative correlation between the proportion of Immigrants from India and labor force participation rate among population between the ages 16 and 19 in the United States with a correlation coefficient (R) of -0.358 and weighted average of 35.0%. Similarly, the statistical analysis conducted on geographies consisting of 82,404,771 people shows a weak negative correlation between the proportion of Immigrants from Yemen and labor force participation rate among population between the ages 16 and 19 in the United States with a correlation coefficient (R) of -0.242 and weighted average of 31.5%, a difference of 11.2%.
In Labor Force | Age 16-19 Correlation Summary
| Measurement | Immigrants from India | Immigrants from Yemen |
| Minimum | 8.1% | 9.6% |
| Maximum | 74.6% | 77.8% |
| Range | 66.5% | 68.2% |
| Mean | 32.9% | 36.1% |
| Median | 33.1% | 34.1% |
| Interquartile 25% (IQ1) | 29.2% | 26.6% |
| Interquartile 75% (IQ3) | 37.2% | 43.7% |
| Interquartile Range (IQR) | 8.0% | 17.0% |
| Standard Deviation (Sample) | 8.5% | 15.1% |
| Standard Deviation (Population) | 8.5% | 14.9% |
Similar Demographics by In Labor Force | Age 16-19
Demographics Similar to Immigrants from India by In Labor Force | Age 16-19
In terms of in labor force | age 16-19, the demographic groups most similar to Immigrants from India are Immigrants from Australia (35.1%, a difference of 0.030%), Immigrants from Vietnam (35.0%, a difference of 0.050%), Inupiat (35.0%, a difference of 0.14%), Immigrants from Philippines (35.1%, a difference of 0.17%), and Immigrants from Central America (35.0%, a difference of 0.23%).
| Demographics | Rating | Rank | In Labor Force | Age 16-19 |
| Immigrants | Honduras | 4.9 /100 | #230 | Tragic 35.2% |
| Immigrants | Syria | 4.5 /100 | #231 | Tragic 35.2% |
| Immigrants | Kazakhstan | 4.5 /100 | #232 | Tragic 35.2% |
| Immigrants | France | 4.3 /100 | #233 | Tragic 35.1% |
| Immigrants | Mexico | 4.2 /100 | #234 | Tragic 35.1% |
| Immigrants | Philippines | 4.0 /100 | #235 | Tragic 35.1% |
| Immigrants | Australia | 3.6 /100 | #236 | Tragic 35.1% |
| Immigrants | India | 3.5 /100 | #237 | Tragic 35.0% |
| Immigrants | Vietnam | 3.4 /100 | #238 | Tragic 35.0% |
| Inupiat | 3.2 /100 | #239 | Tragic 35.0% |
| Immigrants | Central America | 3.0 /100 | #240 | Tragic 35.0% |
| Immigrants | Ireland | 2.9 /100 | #241 | Tragic 35.0% |
| Uruguayans | 2.6 /100 | #242 | Tragic 34.9% |
| Pueblo | 2.6 /100 | #243 | Tragic 34.9% |
| Immigrants | Turkey | 2.6 /100 | #244 | Tragic 34.9% |
Demographics Similar to Immigrants from Yemen by In Labor Force | Age 16-19
In terms of in labor force | age 16-19, the demographic groups most similar to Immigrants from Yemen are Soviet Union (31.4%, a difference of 0.32%), Immigrants from Nicaragua (31.6%, a difference of 0.34%), Ecuadorian (31.4%, a difference of 0.38%), Filipino (31.7%, a difference of 0.53%), and Immigrants from West Indies (31.7%, a difference of 0.62%).
| Demographics | Rating | Rank | In Labor Force | Age 16-19 |
| Indians (Asian) | 0.0 /100 | #311 | Tragic 31.9% |
| Immigrants | Belize | 0.0 /100 | #312 | Tragic 31.8% |
| Hopi | 0.0 /100 | #313 | Tragic 31.8% |
| Cubans | 0.0 /100 | #314 | Tragic 31.8% |
| Immigrants | West Indies | 0.0 /100 | #315 | Tragic 31.7% |
| Filipinos | 0.0 /100 | #316 | Tragic 31.7% |
| Immigrants | Nicaragua | 0.0 /100 | #317 | Tragic 31.6% |
| Immigrants | Yemen | 0.0 /100 | #318 | Tragic 31.5% |
| Soviet Union | 0.0 /100 | #319 | Tragic 31.4% |
| Ecuadorians | 0.0 /100 | #320 | Tragic 31.4% |
| West Indians | 0.0 /100 | #321 | Tragic 31.3% |
| Tohono O'odham | 0.0 /100 | #322 | Tragic 31.3% |
| Immigrants | Caribbean | 0.0 /100 | #323 | Tragic 31.2% |
| Dominicans | 0.0 /100 | #324 | Tragic 31.2% |
| Immigrants | China | 0.0 /100 | #325 | Tragic 31.1% |