Ghanaian vs Immigrants from Kazakhstan In Labor Force | Age 20-64

COMPARE

Ghanaian
Race
Ancestry
AfghanAfricanAlaska NativeAlaskan AthabascanAlbanianAleutAlsatianAmericanApacheArabArapahoArgentineanArmenianAssyrian/Chaldean/SyriacAustralianAustrianBahamianBangladeshiBarbadianBasqueBelgianBelizeanBermudanBhutaneseBlackfeetBolivianBrazilianBritishBritish West IndianBulgarianBurmeseCajunCambodianCanadianCape VerdeanCarpatho RusynCelticCentral AmericanCentral American IndianCherokeeCheyenneChickasawChileanChineseChippewaChoctawColombianColvilleComancheCosta RicanCreeCreekCroatianCrowCubanCypriotCzechCzechoslovakianDanishDelawareDominicanDutchDutch West IndianEastern EuropeanEcuadorianEgyptianEnglishEstonianEthiopianEuropeanFijianFilipinoFinnishFrenchFrench American IndianFrench CanadianGermanGerman RussianGhanaianGreekGuamanian/ChamorroGuatemalanGuyaneseHaitianHmongHonduranHopiHoumaHungarianIcelanderIndian (Asian)IndonesianInupiatIranianIraqiIrishIroquoisIsraeliItalianJamaicanJapaneseJordanianKenyanKiowaKoreanLaotianLatvianLebaneseLiberianLithuanianLumbeeLuxembourgerMacedonianMalaysianMalteseMarshalleseMenomineeMexicanMexican American IndianMongolianMoroccanNative HawaiianNavajoNepaleseNew ZealanderNicaraguanNigerianNorthern EuropeanNorwegianOkinawanOsageOttawaPaiutePakistaniPalestinianPanamanianParaguayanPennsylvania GermanPeruvianPimaPolishPortuguesePotawatomiPuebloPuerto RicanPuget Sound SalishRomanianRussianSalvadoranSamoanScandinavianScotch-IrishScottishSeminoleSenegaleseSerbianShoshoneSierra LeoneanSiouxSlavicSlovakSloveneSomaliSouth AfricanSouth AmericanSouth American IndianSoviet UnionSpaniardSpanishSpanish AmericanSpanish American IndianSri LankanSubsaharan AfricanSudaneseSwedishSwissSyrianTaiwaneseThaiTlingit-HaidaTohono O'OdhamTonganTrinidadian and TobagonianTsimshianTurkishU.S. Virgin IslanderUgandanUkrainianUruguayanUteVenezuelanVietnameseWelshWest IndianYakamaYaquiYugoslavianYumanYup'ikZimbabwean
Immigration
NonimmigrantsImmigrantsAfghanistanAfricaAlbaniaArgentinaArmeniaAsiaAustraliaAustriaBahamasBangladeshBarbadosBelarusBelgiumBelizeBoliviaBosnia and HerzegovinaBrazilBulgariaBurma/MyanmarCabo VerdeCambodiaCameroonCanadaCaribbeanCentral AmericaChileChinaColombiaCongoCosta RicaCroatiaCubaCzechoslovakiaDenmarkDominicaDominican RepublicEastern AfricaEastern AsiaEastern EuropeEcuadorEgyptEl SalvadorEnglandEritreaEthiopiaEuropeFijiFranceGermanyGhanaGreeceGrenadaGuatemalaGuyanaHaitiHondurasHong KongHungaryIndiaIndonesiaIranIraqIrelandIsraelItalyJamaicaJapanJordanKenyaKoreaKuwaitLaosLatin AmericaLatviaLebanonLiberiaLithuaniaMalaysiaMexicoMicronesiaMiddle AfricaMoldovaMoroccoNepalNetherlandsNicaraguaNigeriaNorth AmericaNorth MacedoniaNorthern AfricaNorthern EuropeNorwayOceaniaPakistanPanamaPeruPhilippinesPolandPortugalRomaniaRussiaSaudi ArabiaScotlandSenegalSerbiaSierra LeoneSingaporeSomaliaSouth AfricaSouth AmericaSouth Central AsiaSouth Eastern AsiaSouthern EuropeSpainSri LankaSt. Vincent and the GrenadinesSudanSwedenSwitzerlandSyriaTaiwanThailandTrinidad and TobagoTurkeyUgandaUkraineUruguayUzbekistanVenezuelaVietnamWest IndiesWestern AfricaWestern AsiaWestern EuropeYemenZaireZimbabweAzores
Immigrants from Kazakhstan
Race
Ancestry
AfghanAfricanAlaska NativeAlaskan AthabascanAlbanianAleutAlsatianAmericanApacheArabArapahoArgentineanArmenianAssyrian/Chaldean/SyriacAustralianAustrianBahamianBangladeshiBarbadianBasqueBelgianBelizeanBermudanBhutaneseBlackfeetBolivianBrazilianBritishBritish West IndianBulgarianBurmeseCajunCambodianCanadianCape VerdeanCarpatho RusynCelticCentral AmericanCentral American IndianCherokeeCheyenneChickasawChileanChineseChippewaChoctawColombianColvilleComancheCosta RicanCreeCreekCroatianCrowCubanCypriotCzechCzechoslovakianDanishDelawareDominicanDutchDutch West IndianEastern EuropeanEcuadorianEgyptianEnglishEstonianEthiopianEuropeanFijianFilipinoFinnishFrenchFrench American IndianFrench CanadianGermanGerman RussianGreekGuamanian/ChamorroGuatemalanGuyaneseHaitianHmongHonduranHopiHoumaHungarianIcelanderIndian (Asian)IndonesianInupiatIranianIraqiIrishIroquoisIsraeliItalianJamaicanJapaneseJordanianKenyanKiowaKoreanLaotianLatvianLebaneseLiberianLithuanianLumbeeLuxembourgerMacedonianMalaysianMalteseMarshalleseMenomineeMexicanMexican American IndianMongolianMoroccanNative HawaiianNavajoNepaleseNew ZealanderNicaraguanNigerianNorthern EuropeanNorwegianOkinawanOsageOttawaPaiutePakistaniPalestinianPanamanianParaguayanPennsylvania GermanPeruvianPimaPolishPortuguesePotawatomiPuebloPuerto RicanPuget Sound SalishRomanianRussianSalvadoranSamoanScandinavianScotch-IrishScottishSeminoleSenegaleseSerbianShoshoneSierra LeoneanSiouxSlavicSlovakSloveneSomaliSouth AfricanSouth AmericanSouth American IndianSoviet UnionSpaniardSpanishSpanish AmericanSpanish American IndianSri LankanSubsaharan AfricanSudaneseSwedishSwissSyrianTaiwaneseThaiTlingit-HaidaTohono O'OdhamTonganTrinidadian and TobagonianTsimshianTurkishU.S. Virgin IslanderUgandanUkrainianUruguayanUteVenezuelanVietnameseWelshWest IndianYakamaYaquiYugoslavianYumanYup'ikZimbabwean
Immigration
NonimmigrantsImmigrantsAfghanistanAfricaAlbaniaArgentinaArmeniaAsiaAustraliaAustriaBahamasBangladeshBarbadosBelarusBelgiumBelizeBoliviaBosnia and HerzegovinaBrazilBulgariaBurma/MyanmarCabo VerdeCambodiaCameroonCanadaCaribbeanCentral AmericaChileChinaColombiaCongoCosta RicaCroatiaCubaCzechoslovakiaDenmarkDominicaDominican RepublicEastern AfricaEastern AsiaEastern EuropeEcuadorEgyptEl SalvadorEnglandEritreaEthiopiaEuropeFijiFranceGermanyGhanaGreeceGrenadaGuatemalaGuyanaHaitiHondurasHong KongHungaryIndiaIndonesiaIranIraqIrelandIsraelItalyJamaicaJapanJordanKazakhstanKenyaKoreaKuwaitLaosLatin AmericaLatviaLebanonLiberiaLithuaniaMalaysiaMexicoMicronesiaMiddle AfricaMoldovaMoroccoNepalNetherlandsNicaraguaNigeriaNorth AmericaNorth MacedoniaNorthern AfricaNorthern EuropeNorwayOceaniaPakistanPanamaPeruPhilippinesPolandPortugalRomaniaRussiaSaudi ArabiaScotlandSenegalSerbiaSierra LeoneSingaporeSomaliaSouth AfricaSouth AmericaSouth Central AsiaSouth Eastern AsiaSouthern EuropeSpainSri LankaSt. Vincent and the GrenadinesSudanSwedenSwitzerlandSyriaTaiwanThailandTrinidad and TobagoTurkeyUgandaUkraineUruguayUzbekistanVenezuelaVietnamWest IndiesWestern AfricaWestern AsiaWestern EuropeYemenZaireZimbabweAzores
In Labor Force | Age 20-64
Income
Poverty
Unemployment
Labor Participation
Family Structure
Vehicle Availability
Education Level
Disability

In Labor Force | Age 20-64 Comparison

Ghanaians

Immigrants from Kazakhstan

Exceptional
Good
80.1%
IN LABOR FORCE | AGE 20-64
96.7/ 100
METRIC RATING
92nd/ 347
METRIC RANK
79.7%
IN LABOR FORCE | AGE 20-64
69.5/ 100
METRIC RATING
153rd/ 347
METRIC RANK

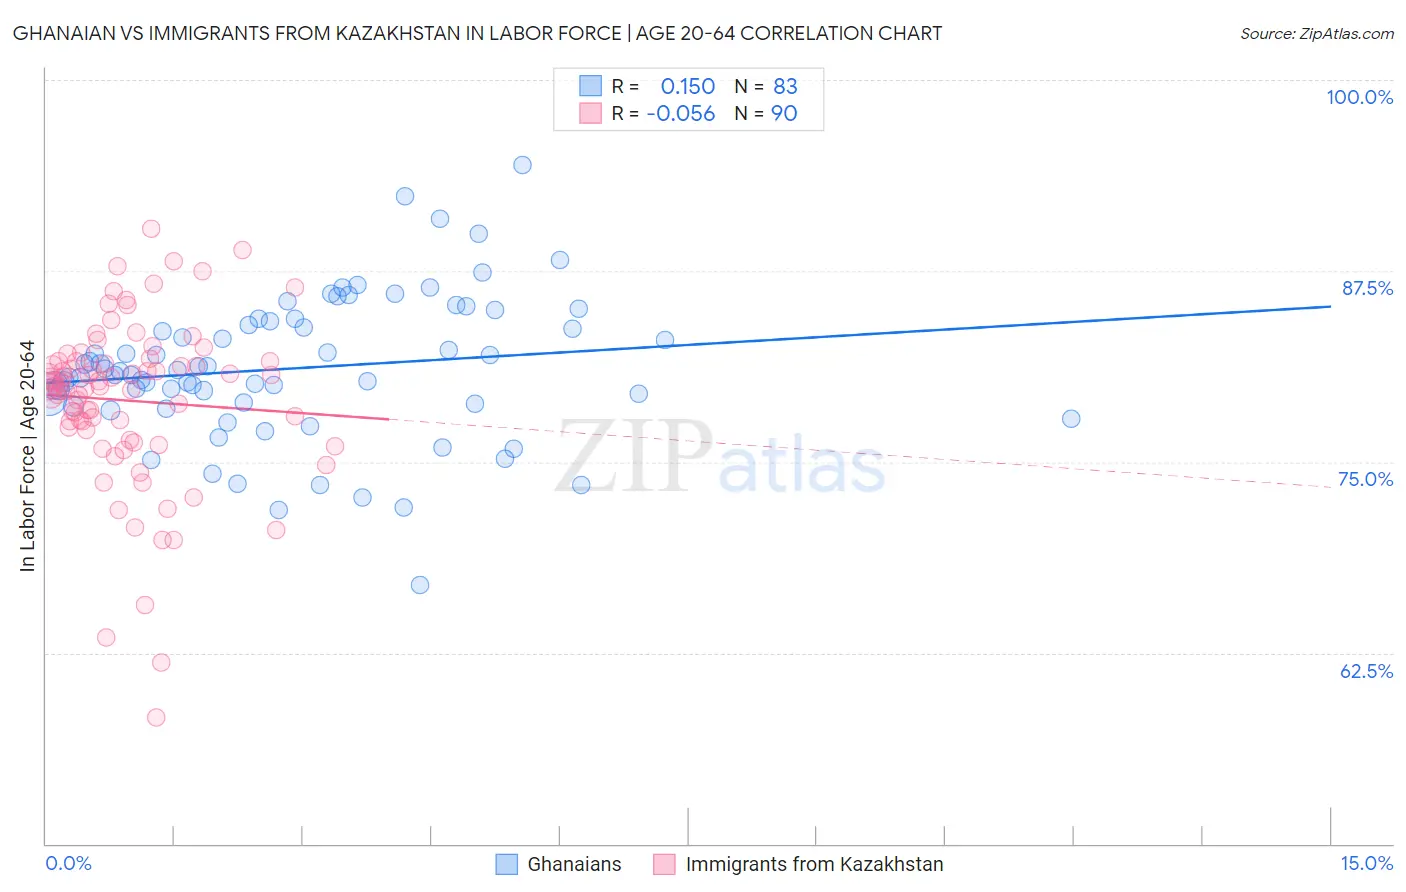
Ghanaian vs Immigrants from Kazakhstan In Labor Force | Age 20-64 Correlation Chart

The statistical analysis conducted on geographies consisting of 190,721,874 people shows a poor positive correlation between the proportion of Ghanaians and labor force participation rate among population between the ages 20 and 64 in the United States with a correlation coefficient (R) of 0.150 and weighted average of 80.1%. Similarly, the statistical analysis conducted on geographies consisting of 124,438,593 people shows a slight negative correlation between the proportion of Immigrants from Kazakhstan and labor force participation rate among population between the ages 20 and 64 in the United States with a correlation coefficient (R) of -0.056 and weighted average of 79.7%, a difference of 0.51%.
Ghanaian vs Immigrants from Kazakhstan In Labor Force | Age 20-64

In Labor Force | Age 20-64 Correlation Summary

MeasurementGhanaianImmigrants from Kazakhstan
Minimum66.9%58.3%
Maximum94.4%90.3%
Range27.5%32.0%
Mean81.1%79.0%
Median80.9%80.0%
Interquartile 25% (IQ1)78.8%77.1%
Interquartile 75% (IQ3)84.2%81.6%
Interquartile Range (IQR)5.4%4.5%
Standard Deviation (Sample)4.7%5.6%
Standard Deviation (Population)4.7%5.5%

Similar Demographics by In Labor Force | Age 20-64

Demographics Similar to Ghanaians by In Labor Force | Age 20-64

In terms of in labor force | age 20-64, the demographic groups most similar to Ghanaians are Uruguayan (80.1%, a difference of 0.0%), Immigrants from Venezuela (80.1%, a difference of 0.010%), Polish (80.1%, a difference of 0.010%), Chilean (80.1%, a difference of 0.020%), and Immigrants from Belarus (80.1%, a difference of 0.020%).
DemographicsRating | RankIn Labor Force | Age 20-64
Jordanians
97.2
/100
|
#85
Exceptional
80.1%
Immigrants | Egypt
97.1
/100
|
#86
Exceptional
80.1%
Croatians
97.1
/100
|
#87
Exceptional
80.1%
Chileans
97.0
/100
|
#88
Exceptional
80.1%
Immigrants | Venezuela
96.8
/100
|
#89
Exceptional
80.1%
Poles
96.8
/100
|
#90
Exceptional
80.1%
Uruguayans
96.7
/100
|
#91
Exceptional
80.1%
Ghanaians
96.7
/100
|
#92
Exceptional
80.1%
Immigrants | Belarus
96.4
/100
|
#93
Exceptional
80.1%
Immigrants | Asia
96.0
/100
|
#94
Exceptional
80.1%
Yugoslavians
95.9
/100
|
#95
Exceptional
80.1%
Immigrants | Malaysia
95.9
/100
|
#96
Exceptional
80.1%
South Americans
95.9
/100
|
#97
Exceptional
80.1%
Immigrants | Uruguay
95.8
/100
|
#98
Exceptional
80.1%
Immigrants | Chile
95.7
/100
|
#99
Exceptional
80.1%

Demographics Similar to Immigrants from Kazakhstan by In Labor Force | Age 20-64

In terms of in labor force | age 20-64, the demographic groups most similar to Immigrants from Kazakhstan are New Zealander (79.7%, a difference of 0.0%), Immigrants from South Africa (79.7%, a difference of 0.0%), Senegalese (79.7%, a difference of 0.0%), Immigrants from China (79.7%, a difference of 0.0%), and Scandinavian (79.7%, a difference of 0.020%).
DemographicsRating | RankIn Labor Force | Age 20-64
Immigrants | Southern Europe
78.9
/100
|
#146
Good
79.8%
Immigrants | Philippines
78.0
/100
|
#147
Good
79.8%
Romanians
77.6
/100
|
#148
Good
79.8%
Icelanders
75.1
/100
|
#149
Good
79.7%
Costa Ricans
72.4
/100
|
#150
Good
79.7%
Scandinavians
72.0
/100
|
#151
Good
79.7%
Immigrants | Northern Europe
72.0
/100
|
#152
Good
79.7%
Immigrants | Kazakhstan
69.5
/100
|
#153
Good
79.7%
New Zealanders
69.4
/100
|
#154
Good
79.7%
Immigrants | South Africa
69.2
/100
|
#155
Good
79.7%
Senegalese
69.1
/100
|
#156
Good
79.7%
Immigrants | China
69.1
/100
|
#157
Good
79.7%
Austrians
67.6
/100
|
#158
Good
79.7%
Immigrants | Cuba
66.7
/100
|
#159
Good
79.7%
Moroccans
66.7
/100
|
#160
Good
79.7%