Cajun vs Okinawan In Labor Force | Age 20-64
COMPARE
Cajun
Okinawan
In Labor Force | Age 20-64
In Labor Force | Age 20-64 Comparison
Cajuns
Okinawans
75.5%
IN LABOR FORCE | AGE 20-64
0.0/ 100
METRIC RATING
323rd/ 347
METRIC RANK
79.6%
IN LABOR FORCE | AGE 20-64
62.7/ 100
METRIC RATING
166th/ 347
METRIC RANK
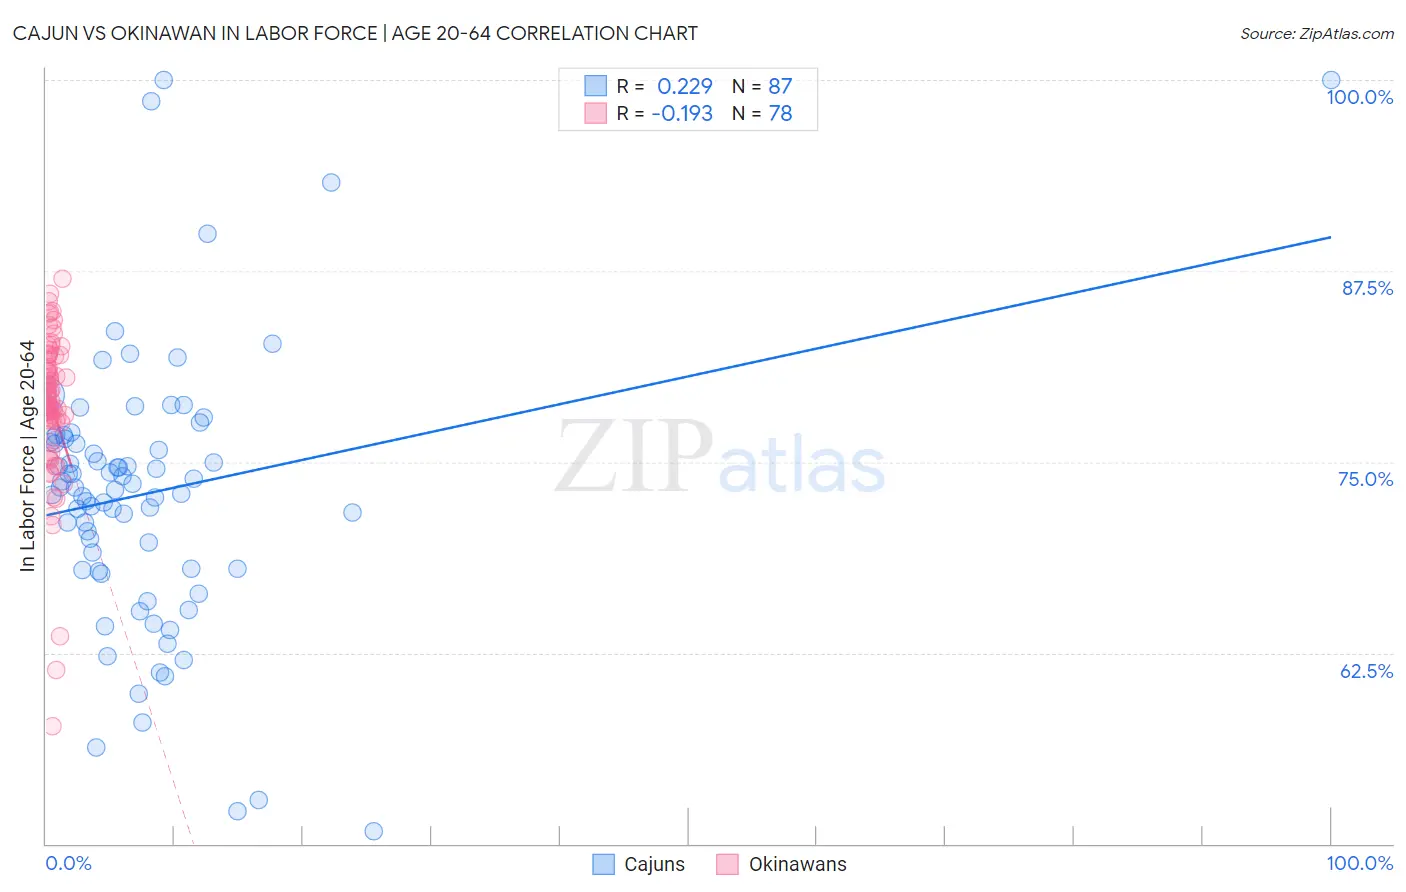
Cajun vs Okinawan In Labor Force | Age 20-64 Correlation Chart
The statistical analysis conducted on geographies consisting of 149,713,173 people shows a weak positive correlation between the proportion of Cajuns and labor force participation rate among population between the ages 20 and 64 in the United States with a correlation coefficient (R) of 0.229 and weighted average of 75.5%. Similarly, the statistical analysis conducted on geographies consisting of 73,775,632 people shows a poor negative correlation between the proportion of Okinawans and labor force participation rate among population between the ages 20 and 64 in the United States with a correlation coefficient (R) of -0.193 and weighted average of 79.6%, a difference of 5.6%.
In Labor Force | Age 20-64 Correlation Summary
| Measurement | Cajun | Okinawan |
| Minimum | 50.8% | 57.7% |
| Maximum | 100.0% | 87.0% |
| Range | 49.2% | 29.3% |
| Mean | 72.9% | 78.7% |
| Median | 73.4% | 79.4% |
| Interquartile 25% (IQ1) | 68.0% | 77.7% |
| Interquartile 75% (IQ3) | 76.6% | 81.9% |
| Interquartile Range (IQR) | 8.6% | 4.2% |
| Standard Deviation (Sample) | 9.0% | 5.0% |
| Standard Deviation (Population) | 8.9% | 4.9% |
Similar Demographics by In Labor Force | Age 20-64
Demographics Similar to Cajuns by In Labor Force | Age 20-64
In terms of in labor force | age 20-64, the demographic groups most similar to Cajuns are Dutch West Indian (75.5%, a difference of 0.040%), Choctaw (75.4%, a difference of 0.060%), Seminole (75.5%, a difference of 0.090%), Menominee (75.3%, a difference of 0.19%), and Creek (75.1%, a difference of 0.42%).
| Demographics | Rating | Rank | In Labor Force | Age 20-64 |
| Yaqui | 0.0 /100 | #316 | Tragic 76.5% |
| Cherokee | 0.0 /100 | #317 | Tragic 76.2% |
| Chickasaw | 0.0 /100 | #318 | Tragic 76.2% |
| Inupiat | 0.0 /100 | #319 | Tragic 76.1% |
| Yakama | 0.0 /100 | #320 | Tragic 75.8% |
| Seminole | 0.0 /100 | #321 | Tragic 75.5% |
| Dutch West Indians | 0.0 /100 | #322 | Tragic 75.5% |
| Cajuns | 0.0 /100 | #323 | Tragic 75.5% |
| Choctaw | 0.0 /100 | #324 | Tragic 75.4% |
| Menominee | 0.0 /100 | #325 | Tragic 75.3% |
| Creek | 0.0 /100 | #326 | Tragic 75.1% |
| Sioux | 0.0 /100 | #327 | Tragic 75.0% |
| Kiowa | 0.0 /100 | #328 | Tragic 75.0% |
| Cheyenne | 0.0 /100 | #329 | Tragic 74.8% |
| Colville | 0.0 /100 | #330 | Tragic 74.8% |
Demographics Similar to Okinawans by In Labor Force | Age 20-64
In terms of in labor force | age 20-64, the demographic groups most similar to Okinawans are Immigrants from Burma/Myanmar (79.7%, a difference of 0.010%), Nigerian (79.7%, a difference of 0.010%), Immigrants from Iraq (79.6%, a difference of 0.010%), Immigrants from Indonesia (79.6%, a difference of 0.010%), and German (79.7%, a difference of 0.020%).
| Demographics | Rating | Rank | In Labor Force | Age 20-64 |
| Immigrants | Cuba | 66.7 /100 | #159 | Good 79.7% |
| Moroccans | 66.7 /100 | #160 | Good 79.7% |
| South Africans | 66.2 /100 | #161 | Good 79.7% |
| Germans | 65.2 /100 | #162 | Good 79.7% |
| Immigrants | Costa Rica | 64.6 /100 | #163 | Good 79.7% |
| Immigrants | Burma/Myanmar | 64.4 /100 | #164 | Good 79.7% |
| Nigerians | 64.0 /100 | #165 | Good 79.7% |
| Okinawans | 62.7 /100 | #166 | Good 79.6% |
| Immigrants | Iraq | 62.0 /100 | #167 | Good 79.6% |
| Immigrants | Indonesia | 61.8 /100 | #168 | Good 79.6% |
| Laotians | 58.4 /100 | #169 | Average 79.6% |
| Slavs | 54.0 /100 | #170 | Average 79.6% |
| Immigrants | Switzerland | 53.3 /100 | #171 | Average 79.6% |
| Immigrants | Belgium | 53.1 /100 | #172 | Average 79.6% |
| Immigrants | Scotland | 52.4 /100 | #173 | Average 79.6% |