Austrian vs Czech In Labor Force | Age > 16

COMPARE

Austrian
Race
Ancestry
AfghanAfricanAlaska NativeAlaskan AthabascanAlbanianAleutAlsatianAmericanApacheArabArapahoArgentineanArmenianAssyrian/Chaldean/SyriacAustralianAustrianBahamianBangladeshiBarbadianBasqueBelgianBelizeanBermudanBhutaneseBlackfeetBolivianBrazilianBritishBritish West IndianBulgarianBurmeseCajunCambodianCanadianCape VerdeanCarpatho RusynCelticCentral AmericanCentral American IndianCherokeeCheyenneChickasawChileanChineseChippewaChoctawColombianColvilleComancheCosta RicanCreeCreekCroatianCrowCubanCypriotCzechoslovakianDanishDelawareDominicanDutchDutch West IndianEastern EuropeanEcuadorianEgyptianEnglishEstonianEthiopianEuropeanFijianFilipinoFinnishFrenchFrench American IndianFrench CanadianGermanGerman RussianGhanaianGreekGuamanian/ChamorroGuatemalanGuyaneseHaitianHmongHonduranHopiHoumaHungarianIcelanderIndian (Asian)IndonesianInupiatIranianIraqiIrishIroquoisIsraeliItalianJamaicanJapaneseJordanianKenyanKiowaKoreanLaotianLatvianLebaneseLiberianLithuanianLumbeeLuxembourgerMacedonianMalaysianMalteseMarshalleseMenomineeMexicanMexican American IndianMongolianMoroccanNative HawaiianNavajoNepaleseNew ZealanderNicaraguanNigerianNorthern EuropeanNorwegianOkinawanOsageOttawaPaiutePakistaniPalestinianPanamanianParaguayanPennsylvania GermanPeruvianPimaPolishPortuguesePotawatomiPuebloPuerto RicanPuget Sound SalishRomanianRussianSalvadoranSamoanScandinavianScotch-IrishScottishSeminoleSenegaleseSerbianShoshoneSierra LeoneanSiouxSlavicSlovakSloveneSomaliSouth AfricanSouth AmericanSouth American IndianSoviet UnionSpaniardSpanishSpanish AmericanSpanish American IndianSri LankanSubsaharan AfricanSudaneseSwedishSwissSyrianTaiwaneseThaiTlingit-HaidaTohono O'OdhamTonganTrinidadian and TobagonianTsimshianTurkishU.S. Virgin IslanderUgandanUkrainianUruguayanUteVenezuelanVietnameseWelshWest IndianYakamaYaquiYugoslavianYumanYup'ikZimbabwean
Immigration
NonimmigrantsImmigrantsAfghanistanAfricaAlbaniaArgentinaArmeniaAsiaAustraliaAustriaBahamasBangladeshBarbadosBelarusBelgiumBelizeBoliviaBosnia and HerzegovinaBrazilBulgariaBurma/MyanmarCabo VerdeCambodiaCameroonCanadaCaribbeanCentral AmericaChileChinaColombiaCongoCosta RicaCroatiaCubaCzechoslovakiaDenmarkDominicaDominican RepublicEastern AfricaEastern AsiaEastern EuropeEcuadorEgyptEl SalvadorEnglandEritreaEthiopiaEuropeFijiFranceGermanyGhanaGreeceGrenadaGuatemalaGuyanaHaitiHondurasHong KongHungaryIndiaIndonesiaIranIraqIrelandIsraelItalyJamaicaJapanJordanKazakhstanKenyaKoreaKuwaitLaosLatin AmericaLatviaLebanonLiberiaLithuaniaMalaysiaMexicoMicronesiaMiddle AfricaMoldovaMoroccoNepalNetherlandsNicaraguaNigeriaNorth AmericaNorth MacedoniaNorthern AfricaNorthern EuropeNorwayOceaniaPakistanPanamaPeruPhilippinesPolandPortugalRomaniaRussiaSaudi ArabiaScotlandSenegalSerbiaSierra LeoneSingaporeSomaliaSouth AfricaSouth AmericaSouth Central AsiaSouth Eastern AsiaSouthern EuropeSpainSri LankaSt. Vincent and the GrenadinesSudanSwedenSwitzerlandSyriaTaiwanThailandTrinidad and TobagoTurkeyUgandaUkraineUruguayUzbekistanVenezuelaVietnamWest IndiesWestern AfricaWestern AsiaWestern EuropeYemenZaireZimbabweAzores
Czech
Race
Ancestry
AfghanAfricanAlaska NativeAlaskan AthabascanAlbanianAleutAlsatianAmericanApacheArabArapahoArgentineanArmenianAssyrian/Chaldean/SyriacAustralianBahamianBangladeshiBarbadianBasqueBelgianBelizeanBermudanBhutaneseBlackfeetBolivianBrazilianBritishBritish West IndianBulgarianBurmeseCajunCambodianCanadianCape VerdeanCarpatho RusynCelticCentral AmericanCentral American IndianCherokeeCheyenneChickasawChileanChineseChippewaChoctawColombianColvilleComancheCosta RicanCreeCreekCroatianCrowCubanCypriotCzechCzechoslovakianDanishDelawareDominicanDutchDutch West IndianEastern EuropeanEcuadorianEgyptianEnglishEstonianEthiopianEuropeanFijianFilipinoFinnishFrenchFrench American IndianFrench CanadianGermanGerman RussianGhanaianGreekGuamanian/ChamorroGuatemalanGuyaneseHaitianHmongHonduranHopiHoumaHungarianIcelanderIndian (Asian)IndonesianInupiatIranianIraqiIrishIroquoisIsraeliItalianJamaicanJapaneseJordanianKenyanKiowaKoreanLaotianLatvianLebaneseLiberianLithuanianLumbeeLuxembourgerMacedonianMalaysianMalteseMarshalleseMenomineeMexicanMexican American IndianMongolianMoroccanNative HawaiianNavajoNepaleseNew ZealanderNicaraguanNigerianNorthern EuropeanNorwegianOkinawanOsageOttawaPaiutePakistaniPalestinianPanamanianParaguayanPennsylvania GermanPeruvianPimaPolishPortuguesePotawatomiPuebloPuerto RicanPuget Sound SalishRomanianRussianSalvadoranSamoanScandinavianScotch-IrishScottishSeminoleSenegaleseSerbianShoshoneSierra LeoneanSiouxSlavicSlovakSloveneSomaliSouth AfricanSouth AmericanSouth American IndianSoviet UnionSpaniardSpanishSpanish AmericanSpanish American IndianSri LankanSubsaharan AfricanSudaneseSwedishSwissSyrianTaiwaneseThaiTlingit-HaidaTohono O'OdhamTonganTrinidadian and TobagonianTsimshianTurkishU.S. Virgin IslanderUgandanUkrainianUruguayanUteVenezuelanVietnameseWelshWest IndianYakamaYaquiYugoslavianYumanYup'ikZimbabwean
Immigration
NonimmigrantsImmigrantsAfghanistanAfricaAlbaniaArgentinaArmeniaAsiaAustraliaAustriaBahamasBangladeshBarbadosBelarusBelgiumBelizeBoliviaBosnia and HerzegovinaBrazilBulgariaBurma/MyanmarCabo VerdeCambodiaCameroonCanadaCaribbeanCentral AmericaChileChinaColombiaCongoCosta RicaCroatiaCubaCzechoslovakiaDenmarkDominicaDominican RepublicEastern AfricaEastern AsiaEastern EuropeEcuadorEgyptEl SalvadorEnglandEritreaEthiopiaEuropeFijiFranceGermanyGhanaGreeceGrenadaGuatemalaGuyanaHaitiHondurasHong KongHungaryIndiaIndonesiaIranIraqIrelandIsraelItalyJamaicaJapanJordanKazakhstanKenyaKoreaKuwaitLaosLatin AmericaLatviaLebanonLiberiaLithuaniaMalaysiaMexicoMicronesiaMiddle AfricaMoldovaMoroccoNepalNetherlandsNicaraguaNigeriaNorth AmericaNorth MacedoniaNorthern AfricaNorthern EuropeNorwayOceaniaPakistanPanamaPeruPhilippinesPolandPortugalRomaniaRussiaSaudi ArabiaScotlandSenegalSerbiaSierra LeoneSingaporeSomaliaSouth AfricaSouth AmericaSouth Central AsiaSouth Eastern AsiaSouthern EuropeSpainSri LankaSt. Vincent and the GrenadinesSudanSwedenSwitzerlandSyriaTaiwanThailandTrinidad and TobagoTurkeyUgandaUkraineUruguayUzbekistanVenezuelaVietnamWest IndiesWestern AfricaWestern AsiaWestern EuropeYemenZaireZimbabweAzores
In Labor Force | Age > 16
Income
Poverty
Unemployment
Labor Participation
Family Structure
Vehicle Availability
Education Level
Disability

In Labor Force | Age > 16 Comparison

Austrians

Czechs

Tragic
Excellent
64.6%
IN LABOR FORCE | AGE > 16
4.6/ 100
METRIC RATING
235th/ 347
METRIC RANK
65.4%
IN LABOR FORCE | AGE > 16
81.5/ 100
METRIC RATING
151st/ 347
METRIC RANK

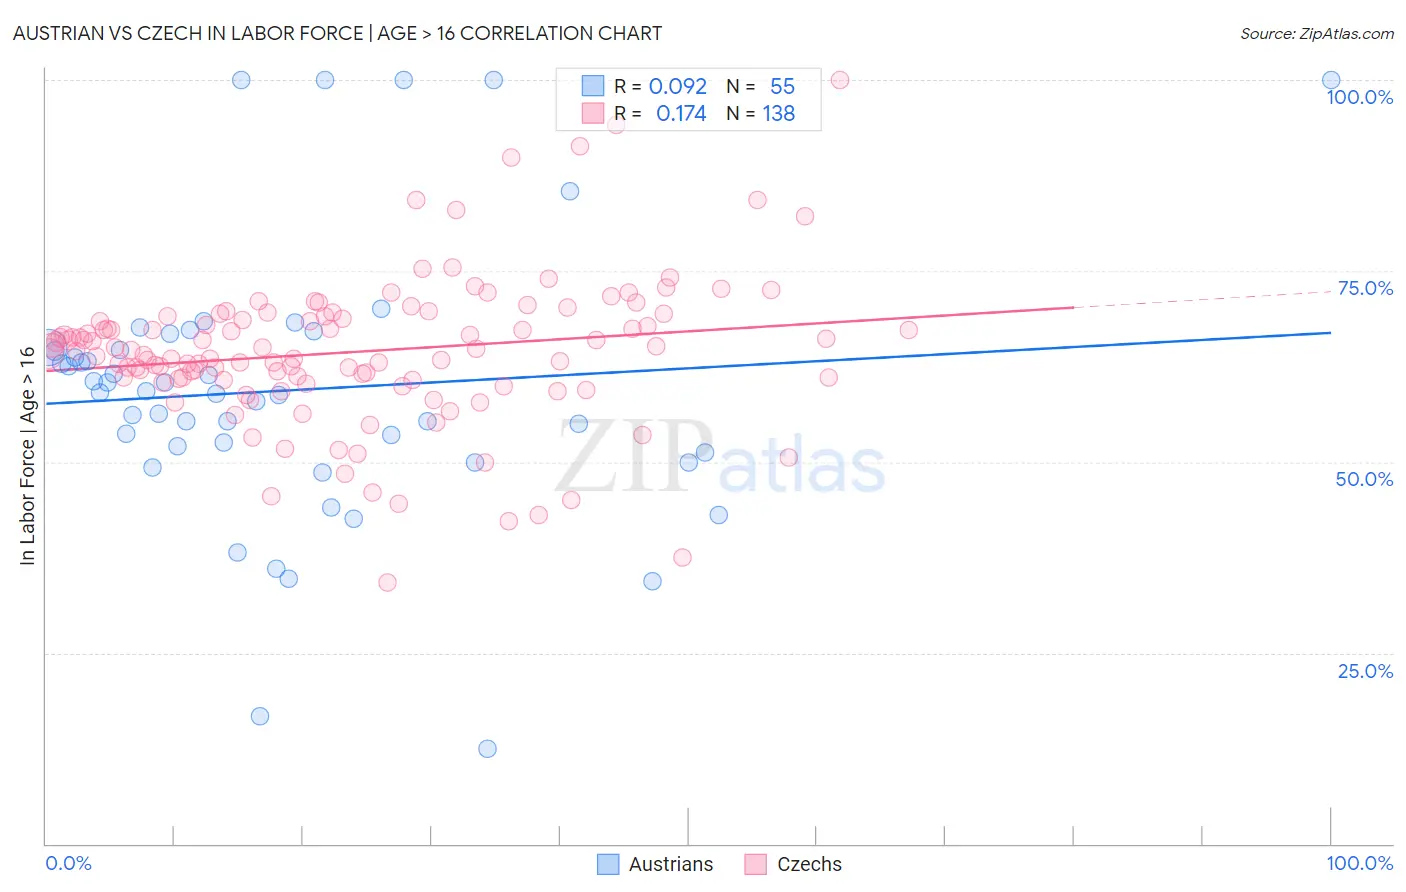
Austrian vs Czech In Labor Force | Age > 16 Correlation Chart

The statistical analysis conducted on geographies consisting of 452,087,528 people shows a slight positive correlation between the proportion of Austrians and labor force participation rate among population ages 16 and over in the United States with a correlation coefficient (R) of 0.092 and weighted average of 64.6%. Similarly, the statistical analysis conducted on geographies consisting of 484,823,613 people shows a poor positive correlation between the proportion of Czechs and labor force participation rate among population ages 16 and over in the United States with a correlation coefficient (R) of 0.174 and weighted average of 65.4%, a difference of 1.3%.
Austrian vs Czech In Labor Force | Age > 16

In Labor Force | Age > 16 Correlation Summary

MeasurementAustrianCzech
Minimum12.5%34.2%
Maximum100.0%100.0%
Range87.5%65.8%
Mean59.4%64.4%
Median59.1%64.6%
Interquartile 25% (IQ1)51.2%60.8%
Interquartile 75% (IQ3)65.0%69.1%
Interquartile Range (IQR)13.8%8.3%
Standard Deviation (Sample)17.9%9.7%
Standard Deviation (Population)17.8%9.7%

Similar Demographics by In Labor Force | Age > 16

Demographics Similar to Austrians by In Labor Force | Age > 16

In terms of in labor force | age > 16, the demographic groups most similar to Austrians are Vietnamese (64.6%, a difference of 0.0%), Immigrants from Norway (64.6%, a difference of 0.0%), Italian (64.6%, a difference of 0.0%), Slavic (64.6%, a difference of 0.020%), and Lebanese (64.5%, a difference of 0.050%).
DemographicsRating | RankIn Labor Force | Age > 16
Northern Europeans
8.2
/100
|
#228
Tragic
64.7%
British
7.3
/100
|
#229
Tragic
64.7%
Chinese
7.3
/100
|
#230
Tragic
64.7%
Immigrants | Northern Europe
7.2
/100
|
#231
Tragic
64.7%
Africans
5.8
/100
|
#232
Tragic
64.6%
Slavs
4.9
/100
|
#233
Tragic
64.6%
Vietnamese
4.7
/100
|
#234
Tragic
64.6%
Austrians
4.6
/100
|
#235
Tragic
64.6%
Immigrants | Norway
4.6
/100
|
#236
Tragic
64.6%
Italians
4.6
/100
|
#237
Tragic
64.6%
Lebanese
3.9
/100
|
#238
Tragic
64.5%
Immigrants | Hungary
3.8
/100
|
#239
Tragic
64.5%
Immigrants | Bangladesh
3.6
/100
|
#240
Tragic
64.5%
Immigrants | Dominica
3.5
/100
|
#241
Tragic
64.5%
Immigrants | Netherlands
3.4
/100
|
#242
Tragic
64.5%

Demographics Similar to Czechs by In Labor Force | Age > 16

In terms of in labor force | age > 16, the demographic groups most similar to Czechs are Yugoslavian (65.4%, a difference of 0.0%), Immigrants (65.4%, a difference of 0.010%), Immigrants from China (65.4%, a difference of 0.020%), Immigrants from Eastern Europe (65.4%, a difference of 0.060%), and Immigrants from Armenia (65.3%, a difference of 0.080%).
DemographicsRating | RankIn Labor Force | Age > 16
Immigrants | Romania
88.6
/100
|
#144
Excellent
65.5%
Tlingit-Haida
88.3
/100
|
#145
Excellent
65.5%
Cypriots
88.2
/100
|
#146
Excellent
65.5%
Immigrants | Oceania
87.5
/100
|
#147
Excellent
65.5%
Bhutanese
86.3
/100
|
#148
Excellent
65.5%
Immigrants | Albania
85.7
/100
|
#149
Excellent
65.4%
Immigrants | Immigrants
81.9
/100
|
#150
Excellent
65.4%
Czechs
81.5
/100
|
#151
Excellent
65.4%
Yugoslavians
81.3
/100
|
#152
Excellent
65.4%
Immigrants | China
80.5
/100
|
#153
Excellent
65.4%
Immigrants | Eastern Europe
78.3
/100
|
#154
Good
65.4%
Immigrants | Armenia
76.6
/100
|
#155
Good
65.3%
Immigrants | Ireland
75.9
/100
|
#156
Good
65.3%
Immigrants | Russia
75.7
/100
|
#157
Good
65.3%
Panamanians
75.2
/100
|
#158
Good
65.3%