Arapaho vs Sudanese In Labor Force | Age 45-54

COMPARE

Arapaho
Race
Ancestry
AfghanAfricanAlaska NativeAlaskan AthabascanAlbanianAleutAlsatianAmericanApacheArabArapahoArgentineanArmenianAssyrian/Chaldean/SyriacAustralianAustrianBahamianBangladeshiBarbadianBasqueBelgianBelizeanBermudanBhutaneseBlackfeetBolivianBrazilianBritishBritish West IndianBulgarianBurmeseCajunCambodianCanadianCape VerdeanCarpatho RusynCelticCentral AmericanCentral American IndianCherokeeCheyenneChickasawChileanChineseChippewaChoctawColombianColvilleComancheCosta RicanCreeCreekCroatianCrowCubanCypriotCzechCzechoslovakianDanishDelawareDominicanDutchDutch West IndianEastern EuropeanEcuadorianEgyptianEnglishEstonianEthiopianEuropeanFijianFilipinoFinnishFrenchFrench American IndianFrench CanadianGermanGerman RussianGhanaianGreekGuamanian/ChamorroGuatemalanGuyaneseHaitianHmongHonduranHopiHoumaHungarianIcelanderIndian (Asian)IndonesianInupiatIranianIraqiIrishIroquoisIsraeliItalianJamaicanJapaneseJordanianKenyanKiowaKoreanLaotianLatvianLebaneseLiberianLithuanianLumbeeLuxembourgerMacedonianMalaysianMalteseMarshalleseMenomineeMexicanMexican American IndianMongolianMoroccanNative HawaiianNavajoNepaleseNew ZealanderNicaraguanNigerianNorthern EuropeanNorwegianOkinawanOsageOttawaPaiutePakistaniPalestinianPanamanianParaguayanPennsylvania GermanPeruvianPimaPolishPortuguesePotawatomiPuebloPuerto RicanPuget Sound SalishRomanianRussianSalvadoranSamoanScandinavianScotch-IrishScottishSeminoleSenegaleseSerbianShoshoneSierra LeoneanSiouxSlavicSlovakSloveneSomaliSouth AfricanSouth AmericanSouth American IndianSoviet UnionSpaniardSpanishSpanish AmericanSpanish American IndianSri LankanSubsaharan AfricanSwedishSwissSyrianTaiwaneseThaiTlingit-HaidaTohono O'OdhamTonganTrinidadian and TobagonianTsimshianTurkishU.S. Virgin IslanderUgandanUkrainianUruguayanUteVenezuelanVietnameseWelshWest IndianYakamaYaquiYugoslavianYumanYup'ikZimbabwean
Immigration
NonimmigrantsImmigrantsAfghanistanAfricaAlbaniaArgentinaArmeniaAsiaAustraliaAustriaBahamasBangladeshBarbadosBelarusBelgiumBelizeBoliviaBosnia and HerzegovinaBrazilBulgariaBurma/MyanmarCabo VerdeCambodiaCameroonCanadaCaribbeanCentral AmericaChileChinaColombiaCongoCosta RicaCroatiaCubaCzechoslovakiaDenmarkDominicaDominican RepublicEastern AfricaEastern AsiaEastern EuropeEcuadorEgyptEl SalvadorEnglandEritreaEthiopiaEuropeFijiFranceGermanyGhanaGreeceGrenadaGuatemalaGuyanaHaitiHondurasHong KongHungaryIndiaIndonesiaIranIraqIrelandIsraelItalyJamaicaJapanJordanKazakhstanKenyaKoreaKuwaitLaosLatin AmericaLatviaLebanonLiberiaLithuaniaMalaysiaMexicoMicronesiaMiddle AfricaMoldovaMoroccoNepalNetherlandsNicaraguaNigeriaNorth AmericaNorth MacedoniaNorthern AfricaNorthern EuropeNorwayOceaniaPakistanPanamaPeruPhilippinesPolandPortugalRomaniaRussiaSaudi ArabiaScotlandSenegalSerbiaSierra LeoneSingaporeSomaliaSouth AfricaSouth AmericaSouth Central AsiaSouth Eastern AsiaSouthern EuropeSpainSri LankaSt. Vincent and the GrenadinesSudanSwedenSwitzerlandSyriaTaiwanThailandTrinidad and TobagoTurkeyUgandaUkraineUruguayUzbekistanVenezuelaVietnamWest IndiesWestern AfricaWestern AsiaWestern EuropeYemenZaireZimbabweAzores
Sudanese
Race
Ancestry
AfghanAfricanAlaska NativeAlaskan AthabascanAlbanianAleutAlsatianAmericanApacheArabArgentineanArmenianAssyrian/Chaldean/SyriacAustralianAustrianBahamianBangladeshiBarbadianBasqueBelgianBelizeanBermudanBhutaneseBlackfeetBolivianBrazilianBritishBritish West IndianBulgarianBurmeseCajunCambodianCanadianCape VerdeanCarpatho RusynCelticCentral AmericanCentral American IndianCherokeeCheyenneChickasawChileanChineseChippewaChoctawColombianColvilleComancheCosta RicanCreeCreekCroatianCrowCubanCypriotCzechCzechoslovakianDanishDelawareDominicanDutchDutch West IndianEastern EuropeanEcuadorianEgyptianEnglishEstonianEthiopianEuropeanFijianFilipinoFinnishFrenchFrench American IndianFrench CanadianGermanGerman RussianGhanaianGreekGuamanian/ChamorroGuatemalanGuyaneseHaitianHmongHonduranHopiHoumaHungarianIcelanderIndian (Asian)IndonesianInupiatIranianIraqiIrishIroquoisIsraeliItalianJamaicanJapaneseJordanianKenyanKiowaKoreanLaotianLatvianLebaneseLiberianLithuanianLumbeeLuxembourgerMacedonianMalaysianMalteseMarshalleseMenomineeMexicanMexican American IndianMongolianMoroccanNative HawaiianNavajoNepaleseNew ZealanderNicaraguanNigerianNorthern EuropeanNorwegianOkinawanOsageOttawaPaiutePakistaniPalestinianPanamanianParaguayanPennsylvania GermanPeruvianPimaPolishPortuguesePotawatomiPuebloPuerto RicanPuget Sound SalishRomanianRussianSalvadoranSamoanScandinavianScotch-IrishScottishSeminoleSenegaleseSerbianShoshoneSierra LeoneanSiouxSlavicSlovakSloveneSomaliSouth AfricanSouth AmericanSouth American IndianSoviet UnionSpaniardSpanishSpanish AmericanSpanish American IndianSri LankanSubsaharan AfricanSudaneseSwedishSwissSyrianTaiwaneseThaiTlingit-HaidaTohono O'OdhamTonganTrinidadian and TobagonianTsimshianTurkishU.S. Virgin IslanderUgandanUkrainianUruguayanUteVenezuelanVietnameseWelshWest IndianYakamaYaquiYugoslavianYumanYup'ikZimbabwean
Immigration
NonimmigrantsImmigrantsAfghanistanAfricaAlbaniaArgentinaArmeniaAsiaAustraliaAustriaBahamasBangladeshBarbadosBelarusBelgiumBelizeBoliviaBosnia and HerzegovinaBrazilBulgariaBurma/MyanmarCabo VerdeCambodiaCameroonCanadaCaribbeanCentral AmericaChileChinaColombiaCongoCosta RicaCroatiaCubaCzechoslovakiaDenmarkDominicaDominican RepublicEastern AfricaEastern AsiaEastern EuropeEcuadorEgyptEl SalvadorEnglandEritreaEthiopiaEuropeFijiFranceGermanyGhanaGreeceGrenadaGuatemalaGuyanaHaitiHondurasHong KongHungaryIndiaIndonesiaIranIraqIrelandIsraelItalyJamaicaJapanJordanKazakhstanKenyaKoreaKuwaitLaosLatin AmericaLatviaLebanonLiberiaLithuaniaMalaysiaMexicoMicronesiaMiddle AfricaMoldovaMoroccoNepalNetherlandsNicaraguaNigeriaNorth AmericaNorth MacedoniaNorthern AfricaNorthern EuropeNorwayOceaniaPakistanPanamaPeruPhilippinesPolandPortugalRomaniaRussiaSaudi ArabiaScotlandSenegalSerbiaSierra LeoneSingaporeSomaliaSouth AfricaSouth AmericaSouth Central AsiaSouth Eastern AsiaSouthern EuropeSpainSri LankaSt. Vincent and the GrenadinesSudanSwedenSwitzerlandSyriaTaiwanThailandTrinidad and TobagoTurkeyUgandaUkraineUruguayUzbekistanVenezuelaVietnamWest IndiesWestern AfricaWestern AsiaWestern EuropeYemenZaireZimbabweAzores
In Labor Force | Age 45-54
Income
Poverty
Unemployment
Labor Participation
Family Structure
Vehicle Availability
Education Level
Disability

In Labor Force | Age 45-54 Comparison

Arapaho

Sudanese

Tragic
Excellent
77.1%
IN LABOR FORCE | AGE 45-54
0.0/ 100
METRIC RATING
335th/ 347
METRIC RANK
83.0%
IN LABOR FORCE | AGE 45-54
82.0/ 100
METRIC RATING
134th/ 347
METRIC RANK

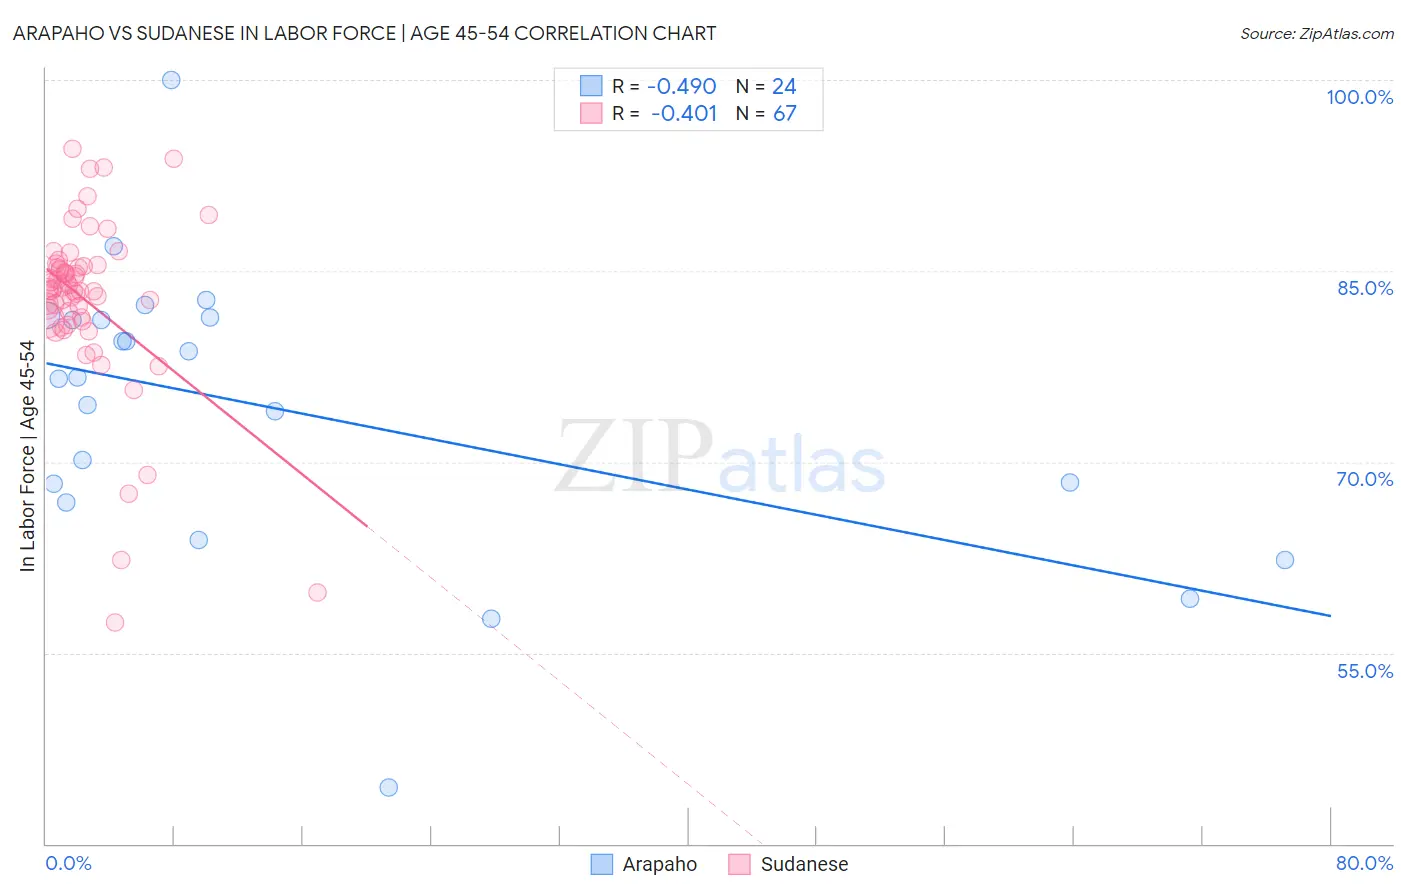
Arapaho vs Sudanese In Labor Force | Age 45-54 Correlation Chart

The statistical analysis conducted on geographies consisting of 29,770,856 people shows a moderate negative correlation between the proportion of Arapaho and labor force participation rate among population between the ages 45 and 54 in the United States with a correlation coefficient (R) of -0.490 and weighted average of 77.1%. Similarly, the statistical analysis conducted on geographies consisting of 110,102,060 people shows a moderate negative correlation between the proportion of Sudanese and labor force participation rate among population between the ages 45 and 54 in the United States with a correlation coefficient (R) of -0.401 and weighted average of 83.0%, a difference of 7.7%.
Arapaho vs Sudanese In Labor Force | Age 45-54

In Labor Force | Age 45-54 Correlation Summary

MeasurementArapahoSudanese
Minimum44.4%57.4%
Maximum100.0%94.6%
Range55.6%37.2%
Mean74.1%82.7%
Median76.6%83.6%
Interquartile 25% (IQ1)67.6%81.1%
Interquartile 75% (IQ3)81.2%85.4%
Interquartile Range (IQR)13.7%4.2%
Standard Deviation (Sample)11.5%6.8%
Standard Deviation (Population)11.2%6.8%

Similar Demographics by In Labor Force | Age 45-54

Demographics Similar to Arapaho by In Labor Force | Age 45-54

In terms of in labor force | age 45-54, the demographic groups most similar to Arapaho are Native/Alaskan (77.1%, a difference of 0.070%), Apache (77.1%, a difference of 0.070%), Menominee (77.4%, a difference of 0.43%), Tsimshian (77.4%, a difference of 0.46%), and Paiute (76.7%, a difference of 0.54%).
DemographicsRating | RankIn Labor Force | Age 45-54
Sioux
0.0
/100
|
#328
Tragic
78.0%
Creek
0.0
/100
|
#329
Tragic
77.7%
Cheyenne
0.0
/100
|
#330
Tragic
77.6%
Tsimshian
0.0
/100
|
#331
Tragic
77.4%
Menominee
0.0
/100
|
#332
Tragic
77.4%
Natives/Alaskans
0.0
/100
|
#333
Tragic
77.1%
Apache
0.0
/100
|
#334
Tragic
77.1%
Arapaho
0.0
/100
|
#335
Tragic
77.1%
Paiute
0.0
/100
|
#336
Tragic
76.7%
Ute
0.0
/100
|
#337
Tragic
76.6%
Yuman
0.0
/100
|
#338
Tragic
76.3%
Puerto Ricans
0.0
/100
|
#339
Tragic
75.9%
Lumbee
0.0
/100
|
#340
Tragic
75.6%
Pueblo
0.0
/100
|
#341
Tragic
75.5%
Tohono O'odham
0.0
/100
|
#342
Tragic
75.1%

Demographics Similar to Sudanese by In Labor Force | Age 45-54

In terms of in labor force | age 45-54, the demographic groups most similar to Sudanese are Immigrants from Ukraine (83.0%, a difference of 0.010%), Liberian (83.0%, a difference of 0.010%), Austrian (83.0%, a difference of 0.010%), Immigrants from Kazakhstan (83.0%, a difference of 0.010%), and Finnish (83.1%, a difference of 0.020%).
DemographicsRating | RankIn Labor Force | Age 45-54
Immigrants | Jordan
85.2
/100
|
#127
Excellent
83.1%
Germans
85.1
/100
|
#128
Excellent
83.1%
Immigrants | Northern Europe
85.1
/100
|
#129
Excellent
83.1%
Immigrants | Israel
84.7
/100
|
#130
Excellent
83.1%
Finns
83.3
/100
|
#131
Excellent
83.1%
Immigrants | Ukraine
82.9
/100
|
#132
Excellent
83.0%
Liberians
82.7
/100
|
#133
Excellent
83.0%
Sudanese
82.0
/100
|
#134
Excellent
83.0%
Austrians
81.3
/100
|
#135
Excellent
83.0%
Immigrants | Kazakhstan
81.0
/100
|
#136
Excellent
83.0%
Immigrants | Spain
80.4
/100
|
#137
Excellent
83.0%
Ghanaians
79.5
/100
|
#138
Good
83.0%
Scandinavians
78.5
/100
|
#139
Good
83.0%
Yugoslavians
78.3
/100
|
#140
Good
83.0%
Immigrants | Haiti
77.9
/100
|
#141
Good
83.0%