Albanian vs Japanese In Labor Force | Age 25-29

COMPARE

Albanian
Race
Ancestry
AfghanAfricanAlaska NativeAlaskan AthabascanAlbanianAleutAlsatianAmericanApacheArabArapahoArgentineanArmenianAssyrian/Chaldean/SyriacAustralianAustrianBahamianBangladeshiBarbadianBasqueBelgianBelizeanBermudanBhutaneseBlackfeetBolivianBrazilianBritishBritish West IndianBulgarianBurmeseCajunCambodianCanadianCape VerdeanCarpatho RusynCelticCentral AmericanCentral American IndianCherokeeCheyenneChickasawChileanChineseChippewaChoctawColombianColvilleComancheCosta RicanCreeCreekCroatianCrowCubanCypriotCzechCzechoslovakianDanishDelawareDominicanDutchDutch West IndianEastern EuropeanEcuadorianEgyptianEnglishEstonianEthiopianEuropeanFijianFilipinoFinnishFrenchFrench American IndianFrench CanadianGermanGerman RussianGhanaianGreekGuamanian/ChamorroGuatemalanGuyaneseHaitianHmongHonduranHopiHoumaHungarianIcelanderIndian (Asian)IndonesianInupiatIranianIraqiIrishIroquoisIsraeliItalianJamaicanJordanianKenyanKiowaKoreanLaotianLatvianLebaneseLiberianLithuanianLumbeeLuxembourgerMacedonianMalaysianMalteseMarshalleseMenomineeMexicanMexican American IndianMongolianMoroccanNative HawaiianNavajoNepaleseNew ZealanderNicaraguanNigerianNorthern EuropeanNorwegianOkinawanOsageOttawaPaiutePakistaniPalestinianPanamanianParaguayanPennsylvania GermanPeruvianPimaPolishPortuguesePotawatomiPuebloPuerto RicanPuget Sound SalishRomanianRussianSalvadoranSamoanScandinavianScotch-IrishScottishSeminoleSenegaleseSerbianShoshoneSierra LeoneanSiouxSlavicSlovakSloveneSomaliSouth AfricanSouth AmericanSouth American IndianSoviet UnionSpaniardSpanishSpanish AmericanSpanish American IndianSri LankanSubsaharan AfricanSudaneseSwedishSwissSyrianTaiwaneseThaiTlingit-HaidaTohono O'OdhamTonganTrinidadian and TobagonianTsimshianTurkishU.S. Virgin IslanderUgandanUkrainianUruguayanUteVenezuelanVietnameseWelshWest IndianYakamaYaquiYugoslavianYumanYup'ikZimbabwean
Immigration
NonimmigrantsImmigrantsAfghanistanAfricaAlbaniaArgentinaArmeniaAsiaAustraliaAustriaBahamasBangladeshBarbadosBelarusBelgiumBelizeBoliviaBosnia and HerzegovinaBrazilBulgariaBurma/MyanmarCabo VerdeCambodiaCameroonCanadaCaribbeanCentral AmericaChileChinaColombiaCongoCosta RicaCroatiaCubaCzechoslovakiaDenmarkDominicaDominican RepublicEastern AfricaEastern AsiaEastern EuropeEcuadorEgyptEl SalvadorEnglandEritreaEthiopiaEuropeFijiFranceGermanyGhanaGreeceGrenadaGuatemalaGuyanaHaitiHondurasHong KongHungaryIndiaIndonesiaIranIraqIrelandIsraelItalyJamaicaJapanJordanKazakhstanKenyaKoreaKuwaitLaosLatin AmericaLatviaLebanonLiberiaLithuaniaMalaysiaMexicoMicronesiaMiddle AfricaMoldovaMoroccoNepalNetherlandsNicaraguaNigeriaNorth AmericaNorth MacedoniaNorthern AfricaNorthern EuropeNorwayOceaniaPakistanPanamaPeruPhilippinesPolandPortugalRomaniaRussiaSaudi ArabiaScotlandSenegalSerbiaSierra LeoneSingaporeSomaliaSouth AfricaSouth AmericaSouth Central AsiaSouth Eastern AsiaSouthern EuropeSpainSri LankaSt. Vincent and the GrenadinesSudanSwedenSwitzerlandSyriaTaiwanThailandTrinidad and TobagoTurkeyUgandaUkraineUruguayUzbekistanVenezuelaVietnamWest IndiesWestern AfricaWestern AsiaWestern EuropeYemenZaireZimbabweAzores
Japanese
Race
Ancestry
AfghanAfricanAlaska NativeAlaskan AthabascanAleutAlsatianAmericanApacheArabArapahoArgentineanArmenianAssyrian/Chaldean/SyriacAustralianAustrianBahamianBangladeshiBarbadianBasqueBelgianBelizeanBermudanBhutaneseBlackfeetBolivianBrazilianBritishBritish West IndianBulgarianBurmeseCajunCambodianCanadianCape VerdeanCarpatho RusynCelticCentral AmericanCentral American IndianCherokeeCheyenneChickasawChileanChineseChippewaChoctawColombianColvilleComancheCosta RicanCreeCreekCroatianCrowCubanCypriotCzechCzechoslovakianDanishDelawareDominicanDutchDutch West IndianEastern EuropeanEcuadorianEgyptianEnglishEstonianEthiopianEuropeanFijianFilipinoFinnishFrenchFrench American IndianFrench CanadianGermanGerman RussianGhanaianGreekGuamanian/ChamorroGuatemalanGuyaneseHaitianHmongHonduranHopiHoumaHungarianIcelanderIndian (Asian)IndonesianInupiatIranianIraqiIrishIroquoisIsraeliItalianJamaicanJapaneseJordanianKenyanKiowaKoreanLaotianLatvianLebaneseLiberianLithuanianLumbeeLuxembourgerMacedonianMalaysianMalteseMarshalleseMenomineeMexicanMexican American IndianMongolianMoroccanNative HawaiianNavajoNepaleseNew ZealanderNicaraguanNigerianNorthern EuropeanNorwegianOkinawanOsageOttawaPaiutePakistaniPalestinianPanamanianParaguayanPennsylvania GermanPeruvianPimaPolishPortuguesePotawatomiPuebloPuerto RicanPuget Sound SalishRomanianRussianSalvadoranSamoanScandinavianScotch-IrishScottishSeminoleSenegaleseSerbianShoshoneSierra LeoneanSiouxSlavicSlovakSloveneSomaliSouth AfricanSouth AmericanSouth American IndianSoviet UnionSpaniardSpanishSpanish AmericanSpanish American IndianSri LankanSubsaharan AfricanSudaneseSwedishSwissSyrianTaiwaneseThaiTlingit-HaidaTohono O'OdhamTonganTrinidadian and TobagonianTsimshianTurkishU.S. Virgin IslanderUgandanUkrainianUruguayanUteVenezuelanVietnameseWelshWest IndianYakamaYaquiYugoslavianYumanYup'ikZimbabwean
Immigration
NonimmigrantsImmigrantsAfghanistanAfricaAlbaniaArgentinaArmeniaAsiaAustraliaAustriaBahamasBangladeshBarbadosBelarusBelgiumBelizeBoliviaBosnia and HerzegovinaBrazilBulgariaBurma/MyanmarCabo VerdeCambodiaCameroonCanadaCaribbeanCentral AmericaChileChinaColombiaCongoCosta RicaCroatiaCubaCzechoslovakiaDenmarkDominicaDominican RepublicEastern AfricaEastern AsiaEastern EuropeEcuadorEgyptEl SalvadorEnglandEritreaEthiopiaEuropeFijiFranceGermanyGhanaGreeceGrenadaGuatemalaGuyanaHaitiHondurasHong KongHungaryIndiaIndonesiaIranIraqIrelandIsraelItalyJamaicaJapanJordanKazakhstanKenyaKoreaKuwaitLaosLatin AmericaLatviaLebanonLiberiaLithuaniaMalaysiaMexicoMicronesiaMiddle AfricaMoldovaMoroccoNepalNetherlandsNicaraguaNigeriaNorth AmericaNorth MacedoniaNorthern AfricaNorthern EuropeNorwayOceaniaPakistanPanamaPeruPhilippinesPolandPortugalRomaniaRussiaSaudi ArabiaScotlandSenegalSerbiaSierra LeoneSingaporeSomaliaSouth AfricaSouth AmericaSouth Central AsiaSouth Eastern AsiaSouthern EuropeSpainSri LankaSt. Vincent and the GrenadinesSudanSwedenSwitzerlandSyriaTaiwanThailandTrinidad and TobagoTurkeyUgandaUkraineUruguayUzbekistanVenezuelaVietnamWest IndiesWestern AfricaWestern AsiaWestern EuropeYemenZaireZimbabweAzores
In Labor Force | Age 25-29
Income
Poverty
Unemployment
Labor Participation
Family Structure
Vehicle Availability
Education Level
Disability

In Labor Force | Age 25-29 Comparison

Albanians

Japanese

Exceptional
Poor
85.5%
IN LABOR FORCE | AGE 25-29
99.7/ 100
METRIC RATING
54th/ 347
METRIC RANK
84.3%
IN LABOR FORCE | AGE 25-29
11.4/ 100
METRIC RATING
213th/ 347
METRIC RANK

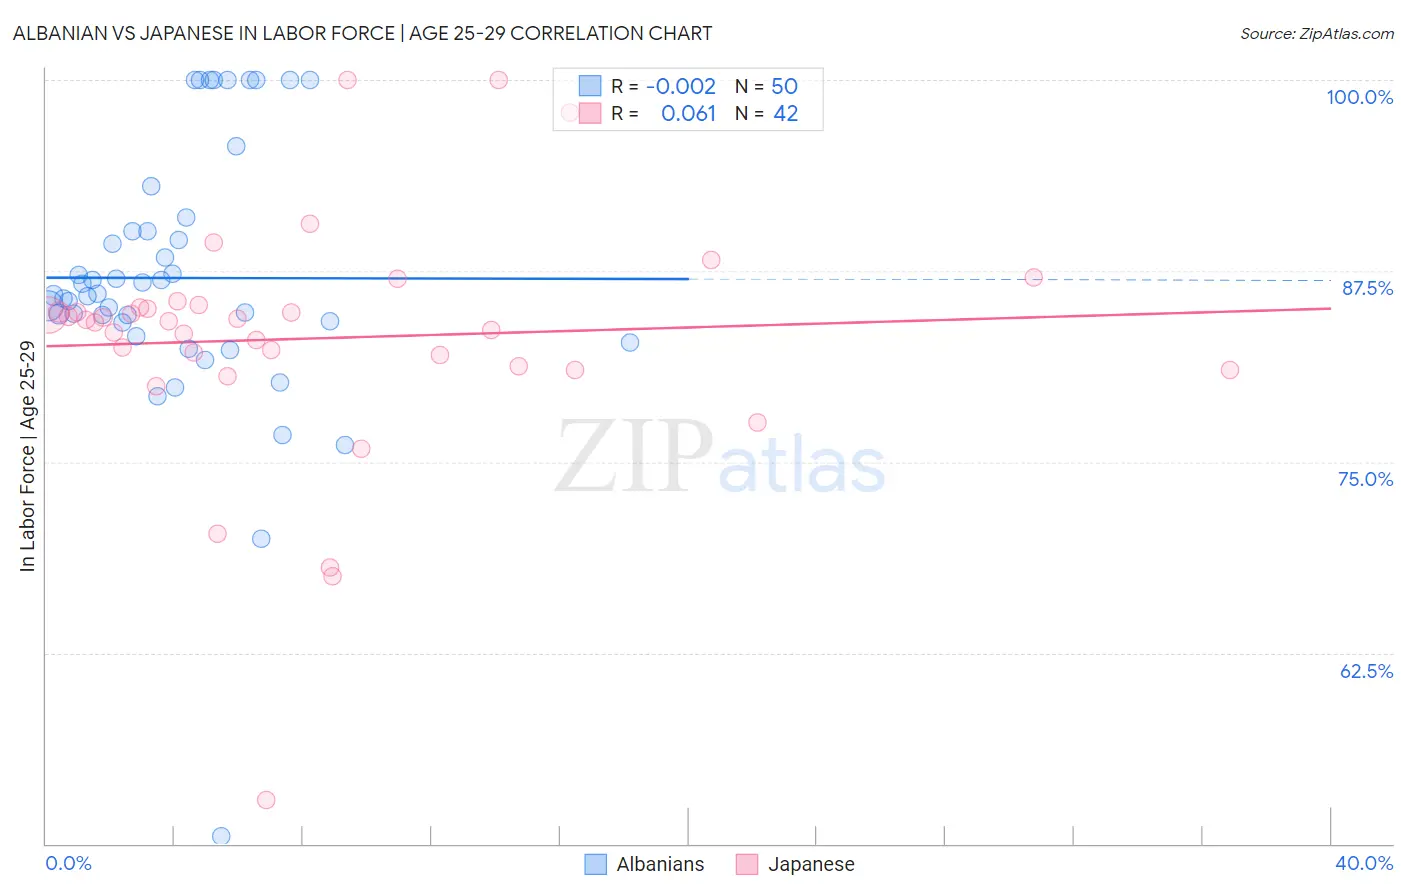
Albanian vs Japanese In Labor Force | Age 25-29 Correlation Chart

The statistical analysis conducted on geographies consisting of 193,233,766 people shows no correlation between the proportion of Albanians and labor force participation rate among population between the ages 25 and 29 in the United States with a correlation coefficient (R) of -0.002 and weighted average of 85.5%. Similarly, the statistical analysis conducted on geographies consisting of 249,141,498 people shows a slight positive correlation between the proportion of Japanese and labor force participation rate among population between the ages 25 and 29 in the United States with a correlation coefficient (R) of 0.061 and weighted average of 84.3%, a difference of 1.4%.
Albanian vs Japanese In Labor Force | Age 25-29

In Labor Force | Age 25-29 Correlation Summary

MeasurementAlbanianJapanese
Minimum50.5%52.9%
Maximum100.0%100.0%
Range49.5%47.1%
Mean87.0%83.1%
Median85.9%84.3%
Interquartile 25% (IQ1)84.2%81.3%
Interquartile 75% (IQ3)90.1%85.1%
Interquartile Range (IQR)5.9%3.8%
Standard Deviation (Sample)8.9%8.0%
Standard Deviation (Population)8.8%7.9%

Similar Demographics by In Labor Force | Age 25-29

Demographics Similar to Albanians by In Labor Force | Age 25-29

In terms of in labor force | age 25-29, the demographic groups most similar to Albanians are Belgian (85.5%, a difference of 0.0%), Immigrants from Brazil (85.5%, a difference of 0.010%), Immigrants from Poland (85.6%, a difference of 0.030%), Eastern European (85.5%, a difference of 0.040%), and Yugoslavian (85.6%, a difference of 0.050%).
DemographicsRating | RankIn Labor Force | Age 25-29
Turks
99.8
/100
|
#47
Exceptional
85.6%
Italians
99.8
/100
|
#48
Exceptional
85.6%
Swedes
99.8
/100
|
#49
Exceptional
85.6%
Yugoslavians
99.8
/100
|
#50
Exceptional
85.6%
Immigrants | Latvia
99.8
/100
|
#51
Exceptional
85.6%
Immigrants | Poland
99.7
/100
|
#52
Exceptional
85.6%
Belgians
99.7
/100
|
#53
Exceptional
85.5%
Albanians
99.7
/100
|
#54
Exceptional
85.5%
Immigrants | Brazil
99.7
/100
|
#55
Exceptional
85.5%
Eastern Europeans
99.6
/100
|
#56
Exceptional
85.5%
Estonians
99.6
/100
|
#57
Exceptional
85.5%
Greeks
99.6
/100
|
#58
Exceptional
85.5%
Immigrants | Morocco
99.5
/100
|
#59
Exceptional
85.5%
Thais
99.5
/100
|
#60
Exceptional
85.5%
Serbians
99.5
/100
|
#61
Exceptional
85.5%

Demographics Similar to Japanese by In Labor Force | Age 25-29

In terms of in labor force | age 25-29, the demographic groups most similar to Japanese are Subsaharan African (84.3%, a difference of 0.0%), Lebanese (84.3%, a difference of 0.010%), Immigrants from Syria (84.3%, a difference of 0.010%), Immigrants from Jordan (84.4%, a difference of 0.020%), and Chinese (84.3%, a difference of 0.020%).
DemographicsRating | RankIn Labor Force | Age 25-29
Immigrants | Cambodia
14.3
/100
|
#206
Poor
84.4%
Immigrants | Armenia
13.3
/100
|
#207
Poor
84.4%
Immigrants | Indonesia
13.2
/100
|
#208
Poor
84.4%
Immigrants | Jordan
12.8
/100
|
#209
Poor
84.4%
Chinese
12.7
/100
|
#210
Poor
84.3%
Immigrants | Venezuela
12.6
/100
|
#211
Poor
84.3%
Sub-Saharan Africans
11.7
/100
|
#212
Poor
84.3%
Japanese
11.4
/100
|
#213
Poor
84.3%
Lebanese
11.1
/100
|
#214
Poor
84.3%
Immigrants | Syria
10.7
/100
|
#215
Poor
84.3%
Israelis
9.3
/100
|
#216
Tragic
84.3%
Immigrants | Ecuador
9.3
/100
|
#217
Tragic
84.3%
Immigrants | Nigeria
9.0
/100
|
#218
Tragic
84.3%
Immigrants | Saudi Arabia
8.8
/100
|
#219
Tragic
84.3%
Nigerians
7.2
/100
|
#220
Tragic
84.3%