Zip Codes with the Highest Percentage of Population Employed in Security & Protection in Lawrence, KS
RELATED REPORTS & OPTIONS
Security & Protection
Lawrence
Compare Zip Codes
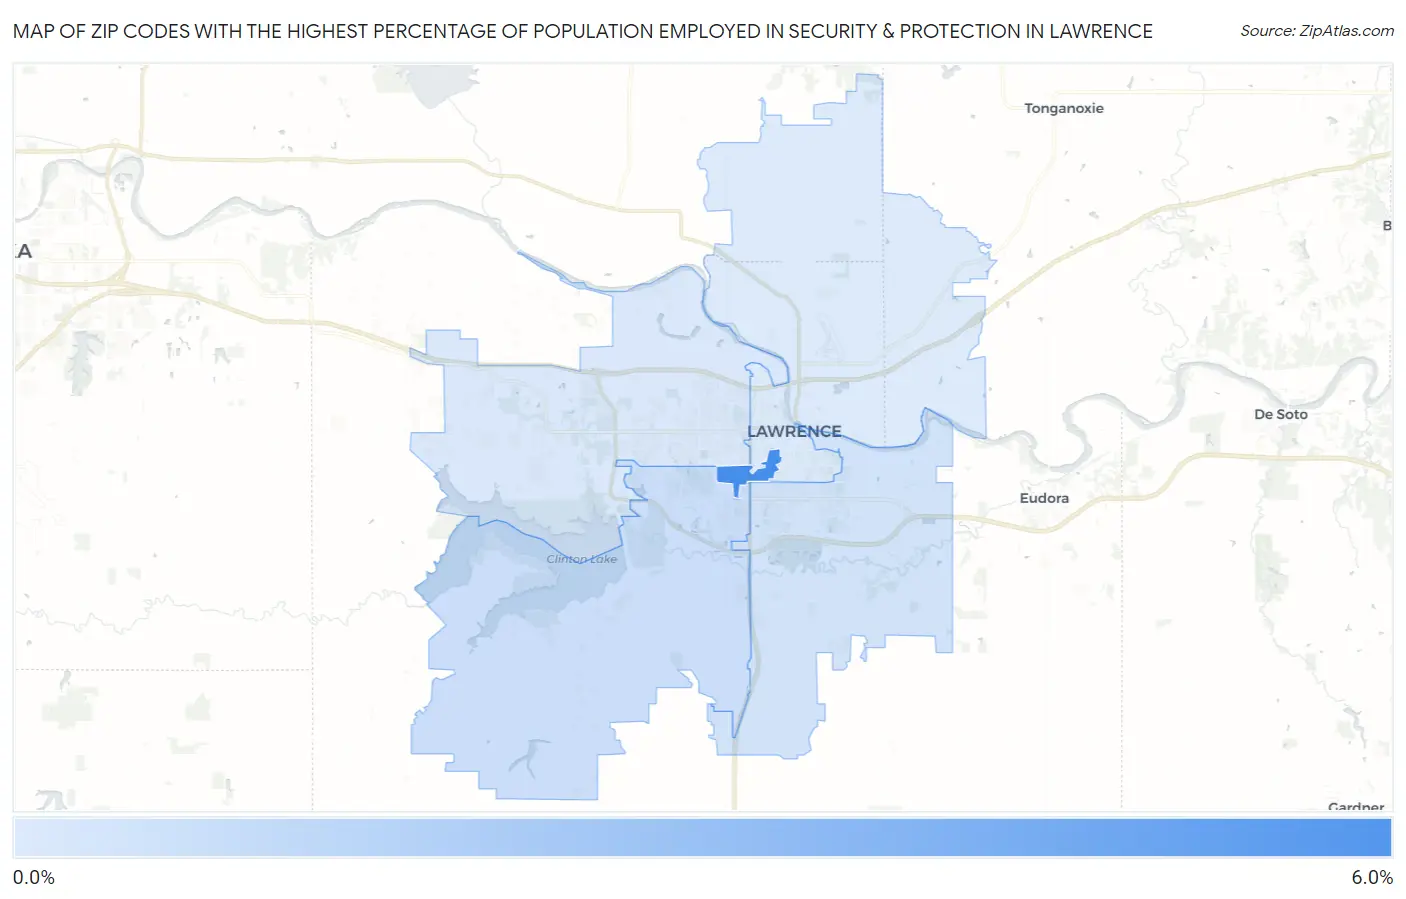
Map of Zip Codes with the Highest Percentage of Population Employed in Security & Protection in Lawrence
0.0%
6.0%
Zip Codes with the Highest Percentage of Population Employed in Security & Protection in Lawrence, KS
| Zip Code | % Employed | vs State | vs National | |
| 1. | 66045 | 5.0% | 1.8%(+3.25)#38 | 2.1%(+2.88)#2,891 |
| 2. | 66047 | 1.6% | 1.8%(-0.222)#261 | 2.1%(-0.595)#15,777 |
| 3. | 66046 | 1.3% | 1.8%(-0.440)#291 | 2.1%(-0.813)#17,454 |
| 4. | 66049 | 1.1% | 1.8%(-0.667)#331 | 2.1%(-1.04)#19,221 |
| 5. | 66044 | 1.1% | 1.8%(-0.710)#336 | 2.1%(-1.08)#19,540 |
1
Common Questions
What are the Top 3 Zip Codes with the Highest Percentage of Population Employed in Security & Protection in Lawrence, KS?
Top 3 Zip Codes with the Highest Percentage of Population Employed in Security & Protection in Lawrence, KS are:
What zip code has the Highest Percentage of Population Employed in Security & Protection in Lawrence, KS?
66045 has the Highest Percentage of Population Employed in Security & Protection in Lawrence, KS with 5.0%.
What is the Percentage of Population Employed in Security & Protection in Lawrence, KS?
Percentage of Population Employed in Security & Protection in Lawrence is 1.2%.
What is the Percentage of Population Employed in Security & Protection in Kansas?
Percentage of Population Employed in Security & Protection in Kansas is 1.8%.
What is the Percentage of Population Employed in Security & Protection in the United States?
Percentage of Population Employed in Security & Protection in the United States is 2.1%.