Zip Codes with the Highest Percentage of Population Employed in Architecture & Engineering in Lawrence, KS
RELATED REPORTS & OPTIONS
Architecture & Engineering
Lawrence
Compare Zip Codes
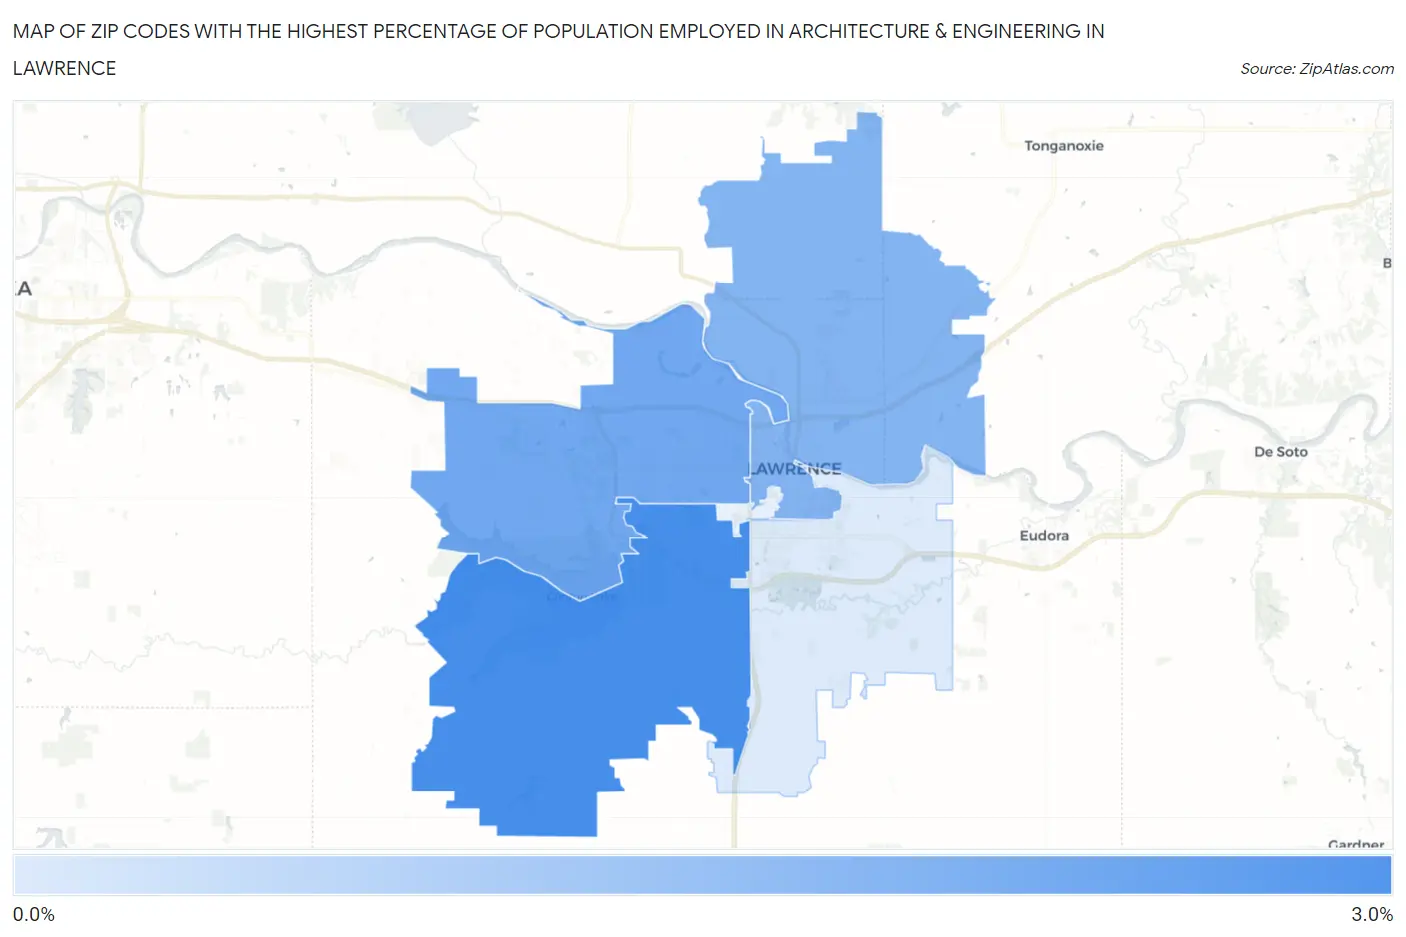
Map of Zip Codes with the Highest Percentage of Population Employed in Architecture & Engineering in Lawrence
0.0%
3.0%
Zip Codes with the Highest Percentage of Population Employed in Architecture & Engineering in Lawrence, KS
| Zip Code | % Employed | vs State | vs National | |
| 1. | 66047 | 2.5% | 2.0%(+0.471)#119 | 2.1%(+0.364)#6,940 |
| 2. | 66049 | 2.0% | 2.0%(-0.092)#166 | 2.1%(-0.199)#9,914 |
| 3. | 66044 | 1.7% | 2.0%(-0.344)#190 | 2.1%(-0.452)#11,510 |
| 4. | 66046 | 0.51% | 2.0%(-1.53)#349 | 2.1%(-1.64)#20,202 |
1
Common Questions
What are the Top 3 Zip Codes with the Highest Percentage of Population Employed in Architecture & Engineering in Lawrence, KS?
Top 3 Zip Codes with the Highest Percentage of Population Employed in Architecture & Engineering in Lawrence, KS are:
What zip code has the Highest Percentage of Population Employed in Architecture & Engineering in Lawrence, KS?
66047 has the Highest Percentage of Population Employed in Architecture & Engineering in Lawrence, KS with 2.5%.
What is the Percentage of Population Employed in Architecture & Engineering in Lawrence, KS?
Percentage of Population Employed in Architecture & Engineering in Lawrence is 1.7%.
What is the Percentage of Population Employed in Architecture & Engineering in Kansas?
Percentage of Population Employed in Architecture & Engineering in Kansas is 2.0%.
What is the Percentage of Population Employed in Architecture & Engineering in the United States?
Percentage of Population Employed in Architecture & Engineering in the United States is 2.1%.