Swiss vs Assyrian/Chaldean/Syriac Median Female Earnings
COMPARE
Swiss
Assyrian/Chaldean/Syriac
Median Female Earnings
Median Female Earnings Comparison
Swiss
Assyrians/Chaldeans/Syriacs
$37,904
MEDIAN FEMALE EARNINGS
2.3/ 100
METRIC RATING
249th/ 347
METRIC RANK
$39,159
MEDIAN FEMALE EARNINGS
24.6/ 100
METRIC RATING
197th/ 347
METRIC RANK
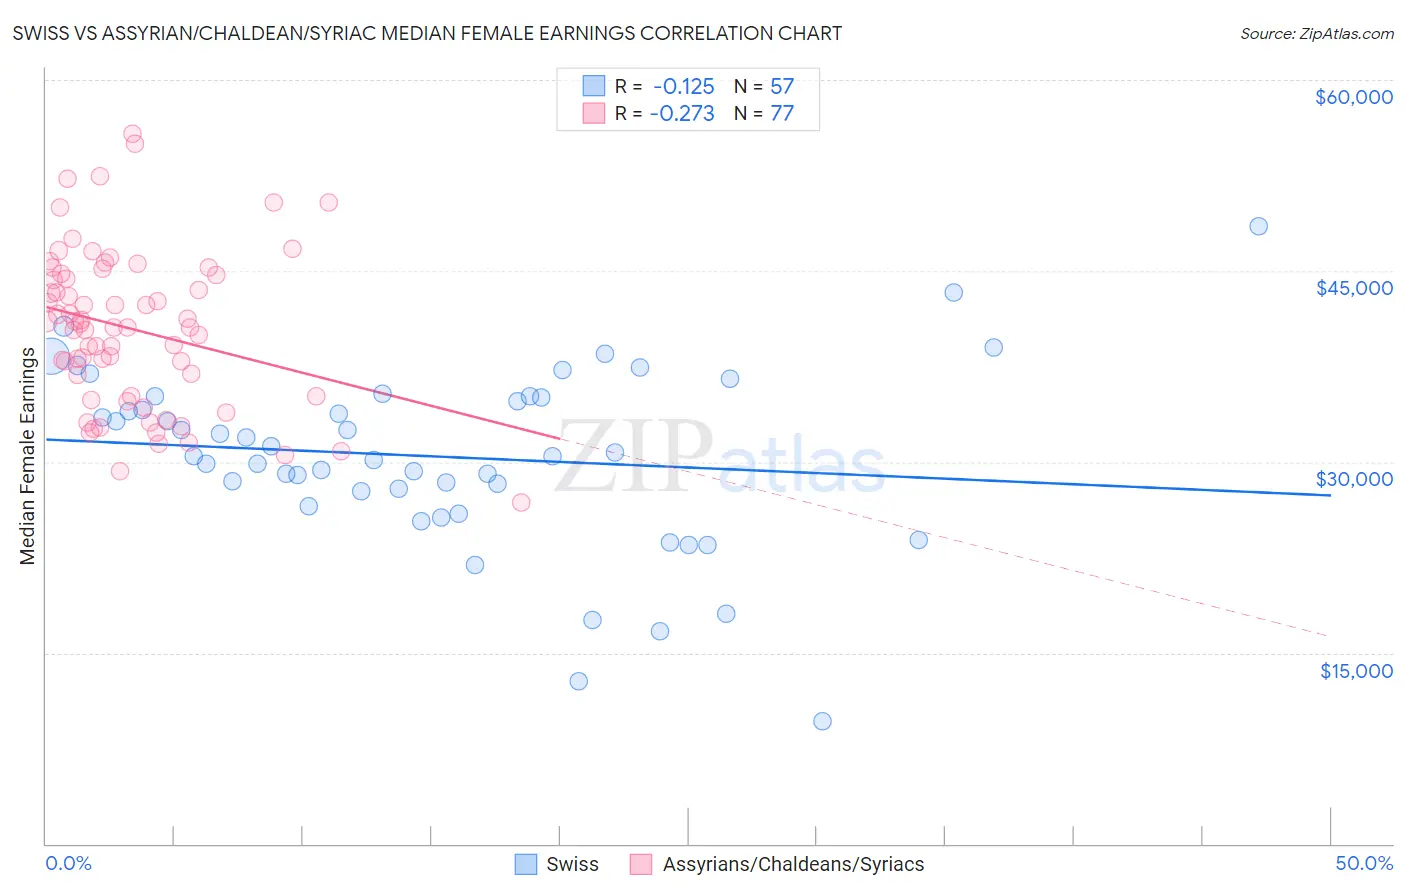
Swiss vs Assyrian/Chaldean/Syriac Median Female Earnings Correlation Chart
The statistical analysis conducted on geographies consisting of 464,484,716 people shows a poor negative correlation between the proportion of Swiss and median female earnings in the United States with a correlation coefficient (R) of -0.125 and weighted average of $37,904. Similarly, the statistical analysis conducted on geographies consisting of 110,265,934 people shows a weak negative correlation between the proportion of Assyrians/Chaldeans/Syriacs and median female earnings in the United States with a correlation coefficient (R) of -0.273 and weighted average of $39,159, a difference of 3.3%.
Median Female Earnings Correlation Summary
| Measurement | Swiss | Assyrian/Chaldean/Syriac |
| Minimum | $9,649 | $26,764 |
| Maximum | $48,533 | $55,774 |
| Range | $38,884 | $29,010 |
| Mean | $30,422 | $40,436 |
| Median | $30,468 | $40,603 |
| Interquartile 25% (IQ1) | $27,075 | $35,184 |
| Interquartile 75% (IQ3) | $35,111 | $44,710 |
| Interquartile Range (IQR) | $8,036 | $9,527 |
| Standard Deviation (Sample) | $7,120 | $6,169 |
| Standard Deviation (Population) | $7,057 | $6,129 |
Similar Demographics by Median Female Earnings
Demographics Similar to Swiss by Median Female Earnings
In terms of median female earnings, the demographic groups most similar to Swiss are Alaskan Athabascan ($37,905, a difference of 0.0%), Immigrants from Somalia ($37,914, a difference of 0.030%), Immigrants from Iraq ($37,864, a difference of 0.11%), Welsh ($37,856, a difference of 0.13%), and Immigrants from Middle Africa ($37,965, a difference of 0.16%).
| Demographics | Rating | Rank | Median Female Earnings |
| Immigrants | Burma/Myanmar | 3.0 /100 | #242 | Tragic $38,028 |
| Germans | 2.8 /100 | #243 | Tragic $37,986 |
| Immigrants | Liberia | 2.7 /100 | #244 | Tragic $37,970 |
| Immigrants | Middle Africa | 2.7 /100 | #245 | Tragic $37,965 |
| Delaware | 2.6 /100 | #246 | Tragic $37,964 |
| Immigrants | Somalia | 2.4 /100 | #247 | Tragic $37,914 |
| Alaskan Athabascans | 2.3 /100 | #248 | Tragic $37,905 |
| Swiss | 2.3 /100 | #249 | Tragic $37,904 |
| Immigrants | Iraq | 2.2 /100 | #250 | Tragic $37,864 |
| Welsh | 2.1 /100 | #251 | Tragic $37,856 |
| Immigrants | Dominica | 2.0 /100 | #252 | Tragic $37,825 |
| Danes | 1.6 /100 | #253 | Tragic $37,730 |
| Whites/Caucasians | 1.1 /100 | #254 | Tragic $37,531 |
| Colville | 1.1 /100 | #255 | Tragic $37,514 |
| Samoans | 1.0 /100 | #256 | Tragic $37,498 |
Demographics Similar to Assyrians/Chaldeans/Syriacs by Median Female Earnings
In terms of median female earnings, the demographic groups most similar to Assyrians/Chaldeans/Syriacs are Immigrants from Costa Rica ($39,186, a difference of 0.070%), Ecuadorian ($39,117, a difference of 0.11%), Icelander ($39,109, a difference of 0.13%), Uruguayan ($39,228, a difference of 0.17%), and Immigrants from Panama ($39,049, a difference of 0.28%).
| Demographics | Rating | Rank | Median Female Earnings |
| Puget Sound Salish | 33.9 /100 | #190 | Fair $39,376 |
| Immigrants | Western Africa | 32.7 /100 | #191 | Fair $39,351 |
| Immigrants | Immigrants | 31.7 /100 | #192 | Fair $39,328 |
| Immigrants | Nigeria | 30.2 /100 | #193 | Fair $39,294 |
| Irish | 30.0 /100 | #194 | Fair $39,291 |
| Uruguayans | 27.3 /100 | #195 | Fair $39,228 |
| Immigrants | Costa Rica | 25.6 /100 | #196 | Fair $39,186 |
| Assyrians/Chaldeans/Syriacs | 24.6 /100 | #197 | Fair $39,159 |
| Ecuadorians | 23.0 /100 | #198 | Fair $39,117 |
| Icelanders | 22.7 /100 | #199 | Fair $39,109 |
| Immigrants | Panama | 20.6 /100 | #200 | Fair $39,049 |
| Panamanians | 20.6 /100 | #201 | Fair $39,049 |
| Slovaks | 19.9 /100 | #202 | Poor $39,029 |
| Czechs | 18.7 /100 | #203 | Poor $38,992 |
| Immigrants | Uruguay | 17.3 /100 | #204 | Poor $38,945 |