Slavic vs Yup'ik Median Family Income
COMPARE
Slavic
Yup'ik
Median Family Income
Median Family Income Comparison
Slavs
Yup'ik
$105,144
MEDIAN FAMILY INCOME
77.9/ 100
METRIC RATING
153rd/ 347
METRIC RANK
$79,290
MEDIAN FAMILY INCOME
0.0/ 100
METRIC RATING
335th/ 347
METRIC RANK
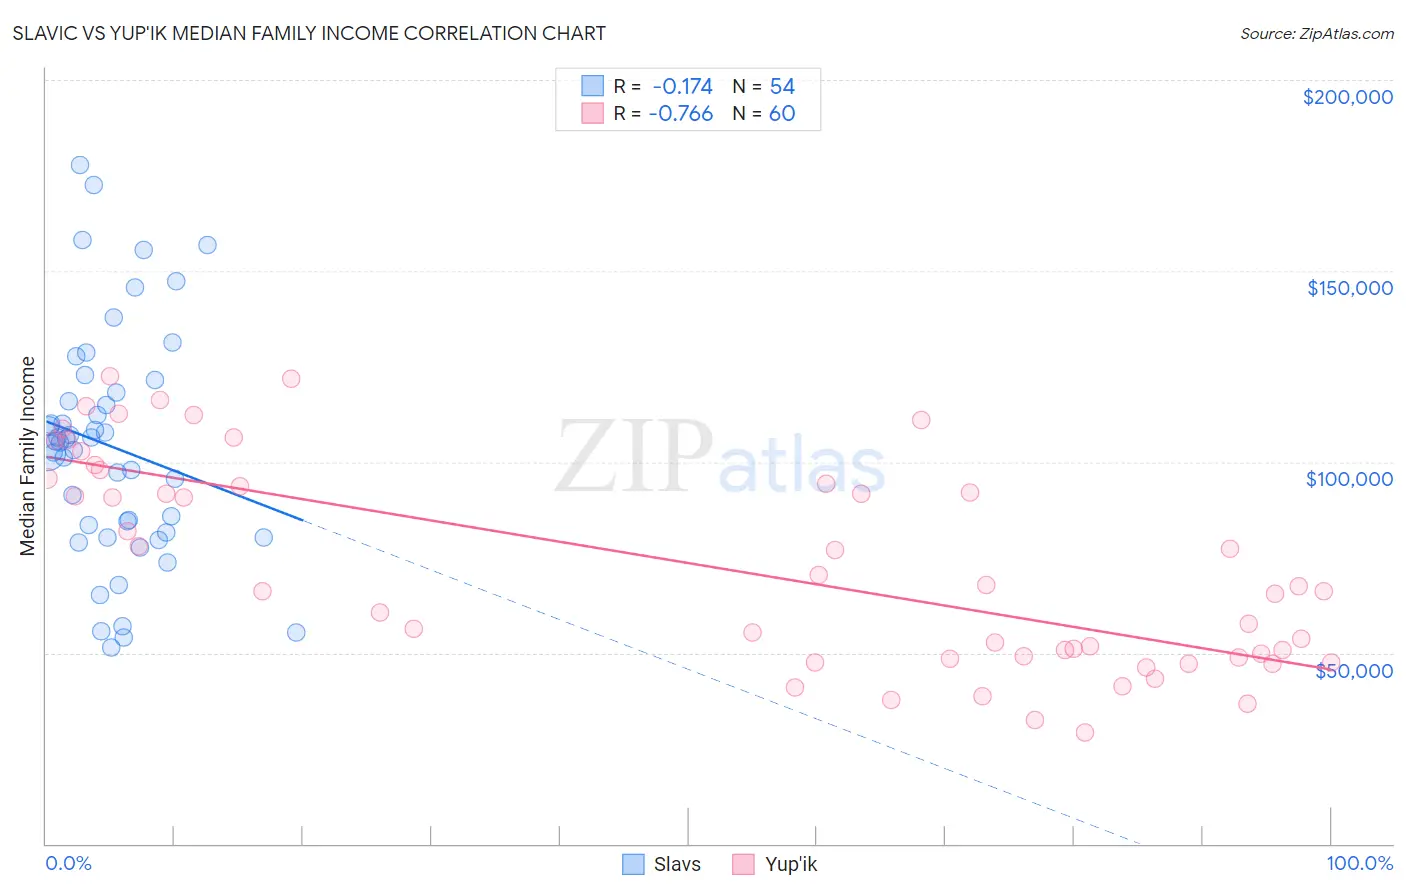
Slavic vs Yup'ik Median Family Income Correlation Chart
The statistical analysis conducted on geographies consisting of 270,767,146 people shows a poor negative correlation between the proportion of Slavs and median family income in the United States with a correlation coefficient (R) of -0.174 and weighted average of $105,144. Similarly, the statistical analysis conducted on geographies consisting of 39,952,310 people shows a strong negative correlation between the proportion of Yup'ik and median family income in the United States with a correlation coefficient (R) of -0.766 and weighted average of $79,290, a difference of 32.6%.
Median Family Income Correlation Summary
| Measurement | Slavic | Yup'ik |
| Minimum | $51,429 | $29,250 |
| Maximum | $177,700 | $122,399 |
| Range | $126,271 | $93,149 |
| Mean | $103,941 | $72,637 |
| Median | $105,172 | $66,875 |
| Interquartile 25% (IQ1) | $81,417 | $48,824 |
| Interquartile 75% (IQ3) | $118,102 | $95,045 |
| Interquartile Range (IQR) | $36,685 | $46,221 |
| Standard Deviation (Sample) | $30,026 | $27,024 |
| Standard Deviation (Population) | $29,746 | $26,798 |
Similar Demographics by Median Family Income
Demographics Similar to Slavs by Median Family Income
In terms of median family income, the demographic groups most similar to Slavs are Immigrants from Albania ($105,285, a difference of 0.13%), Immigrants from Nepal ($104,966, a difference of 0.17%), Native Hawaiian ($104,910, a difference of 0.22%), Peruvian ($105,444, a difference of 0.28%), and Irish ($105,453, a difference of 0.29%).
| Demographics | Rating | Rank | Median Family Income |
| Czechs | 83.4 /100 | #146 | Excellent $105,839 |
| Immigrants | Chile | 82.1 /100 | #147 | Excellent $105,655 |
| Hungarians | 81.7 /100 | #148 | Excellent $105,609 |
| Immigrants | Germany | 80.9 /100 | #149 | Excellent $105,507 |
| Irish | 80.5 /100 | #150 | Excellent $105,453 |
| Peruvians | 80.4 /100 | #151 | Excellent $105,444 |
| Immigrants | Albania | 79.1 /100 | #152 | Good $105,285 |
| Slavs | 77.9 /100 | #153 | Good $105,144 |
| Immigrants | Nepal | 76.3 /100 | #154 | Good $104,966 |
| Native Hawaiians | 75.8 /100 | #155 | Good $104,910 |
| Basques | 74.4 /100 | #156 | Good $104,760 |
| Moroccans | 71.6 /100 | #157 | Good $104,488 |
| Scandinavians | 70.8 /100 | #158 | Good $104,410 |
| Swiss | 70.7 /100 | #159 | Good $104,396 |
| Scottish | 69.5 /100 | #160 | Good $104,288 |
Demographics Similar to Yup'ik by Median Family Income
In terms of median family income, the demographic groups most similar to Yup'ik are Menominee ($79,563, a difference of 0.34%), Immigrants from Cuba ($78,249, a difference of 1.3%), Yuman ($78,055, a difference of 1.6%), Kiowa ($80,885, a difference of 2.0%), and Native/Alaskan ($80,908, a difference of 2.0%).
| Demographics | Rating | Rank | Median Family Income |
| Blacks/African Americans | 0.0 /100 | #328 | Tragic $81,912 |
| Dutch West Indians | 0.0 /100 | #329 | Tragic $81,852 |
| Cheyenne | 0.0 /100 | #330 | Tragic $81,385 |
| Immigrants | Dominican Republic | 0.0 /100 | #331 | Tragic $81,233 |
| Natives/Alaskans | 0.0 /100 | #332 | Tragic $80,908 |
| Kiowa | 0.0 /100 | #333 | Tragic $80,885 |
| Menominee | 0.0 /100 | #334 | Tragic $79,563 |
| Yup'ik | 0.0 /100 | #335 | Tragic $79,290 |
| Immigrants | Cuba | 0.0 /100 | #336 | Tragic $78,249 |
| Yuman | 0.0 /100 | #337 | Tragic $78,055 |
| Immigrants | Yemen | 0.0 /100 | #338 | Tragic $77,457 |
| Pima | 0.0 /100 | #339 | Tragic $77,431 |
| Hopi | 0.0 /100 | #340 | Tragic $77,188 |
| Pueblo | 0.0 /100 | #341 | Tragic $76,880 |
| Crow | 0.0 /100 | #342 | Tragic $76,605 |