Shoshone vs Immigrants from Cuba Median Household Income
COMPARE
Shoshone
Immigrants from Cuba
Median Household Income
Median Household Income Comparison
Shoshone
Immigrants from Cuba
$72,660
MEDIAN HOUSEHOLD INCOME
0.0/ 100
METRIC RATING
302nd/ 347
METRIC RANK
$68,461
MEDIAN HOUSEHOLD INCOME
0.0/ 100
METRIC RATING
327th/ 347
METRIC RANK
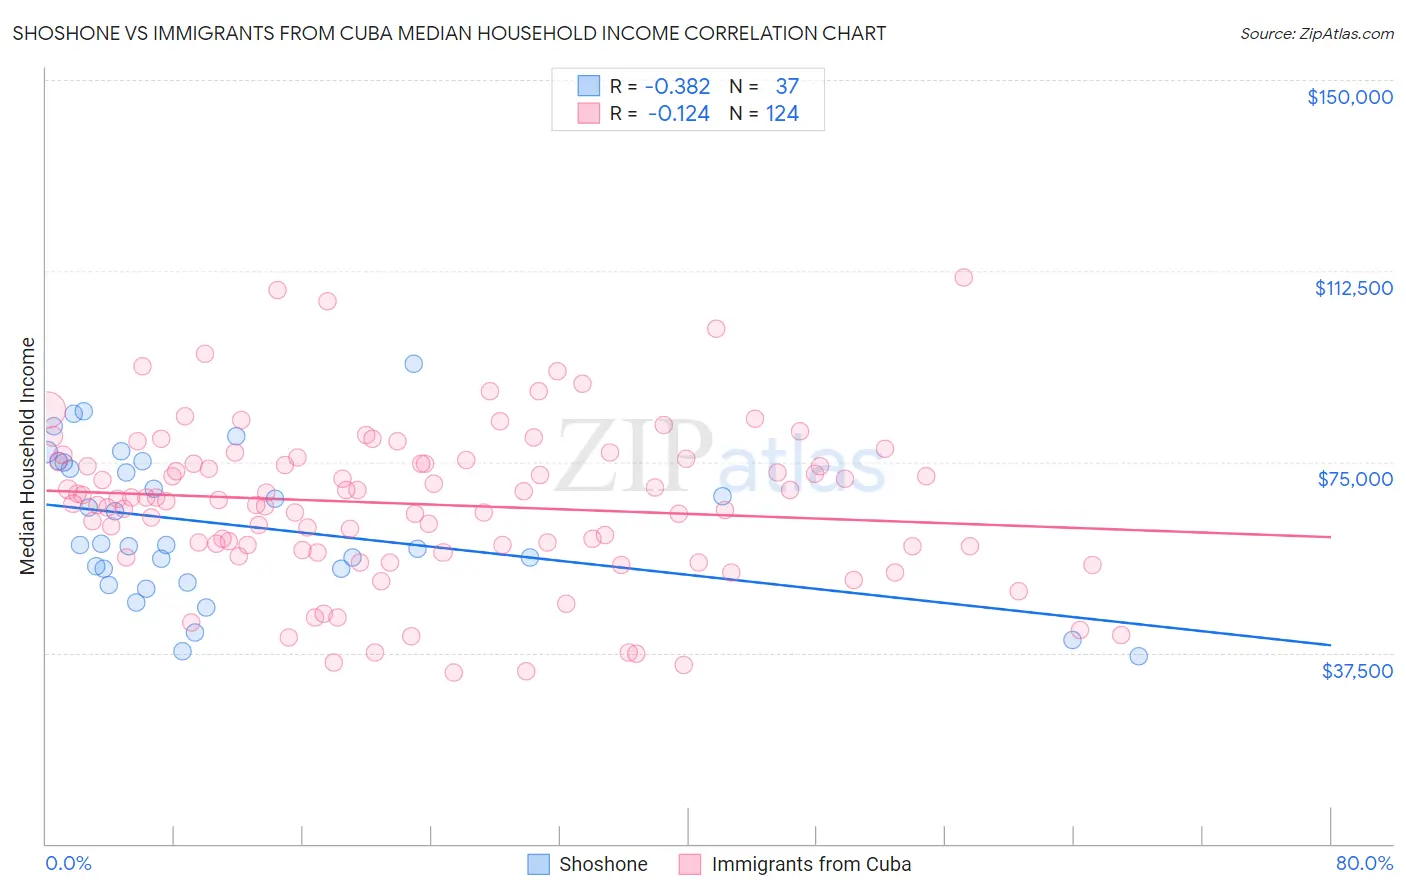
Shoshone vs Immigrants from Cuba Median Household Income Correlation Chart
The statistical analysis conducted on geographies consisting of 66,612,449 people shows a mild negative correlation between the proportion of Shoshone and median household income in the United States with a correlation coefficient (R) of -0.382 and weighted average of $72,660. Similarly, the statistical analysis conducted on geographies consisting of 325,902,946 people shows a poor negative correlation between the proportion of Immigrants from Cuba and median household income in the United States with a correlation coefficient (R) of -0.124 and weighted average of $68,461, a difference of 6.1%.
Median Household Income Correlation Summary
| Measurement | Shoshone | Immigrants from Cuba |
| Minimum | $36,823 | $33,697 |
| Maximum | $94,375 | $111,328 |
| Range | $57,552 | $77,631 |
| Mean | $62,559 | $66,701 |
| Median | $58,750 | $67,566 |
| Interquartile 25% (IQ1) | $52,629 | $57,982 |
| Interquartile 75% (IQ3) | $75,002 | $75,238 |
| Interquartile Range (IQR) | $22,372 | $17,257 |
| Standard Deviation (Sample) | $14,416 | $15,525 |
| Standard Deviation (Population) | $14,219 | $15,462 |
Similar Demographics by Median Household Income
Demographics Similar to Shoshone by Median Household Income
In terms of median household income, the demographic groups most similar to Shoshone are African ($72,650, a difference of 0.010%), Cherokee ($72,682, a difference of 0.030%), Immigrants from Haiti ($72,599, a difference of 0.080%), Honduran ($72,588, a difference of 0.10%), and Potawatomi ($72,576, a difference of 0.12%).
| Demographics | Rating | Rank | Median Household Income |
| Cubans | 0.1 /100 | #295 | Tragic $73,392 |
| Haitians | 0.1 /100 | #296 | Tragic $73,306 |
| Immigrants | Mexico | 0.0 /100 | #297 | Tragic $73,160 |
| Paiute | 0.0 /100 | #298 | Tragic $72,959 |
| Indonesians | 0.0 /100 | #299 | Tragic $72,856 |
| Immigrants | Dominica | 0.0 /100 | #300 | Tragic $72,760 |
| Cherokee | 0.0 /100 | #301 | Tragic $72,682 |
| Shoshone | 0.0 /100 | #302 | Tragic $72,660 |
| Africans | 0.0 /100 | #303 | Tragic $72,650 |
| Immigrants | Haiti | 0.0 /100 | #304 | Tragic $72,599 |
| Hondurans | 0.0 /100 | #305 | Tragic $72,588 |
| Potawatomi | 0.0 /100 | #306 | Tragic $72,576 |
| Ute | 0.0 /100 | #307 | Tragic $72,402 |
| Yakama | 0.0 /100 | #308 | Tragic $72,225 |
| Immigrants | Caribbean | 0.0 /100 | #309 | Tragic $71,860 |
Demographics Similar to Immigrants from Cuba by Median Household Income
In terms of median household income, the demographic groups most similar to Immigrants from Cuba are Menominee ($68,423, a difference of 0.060%), Dutch West Indian ($68,412, a difference of 0.070%), Yuman ($68,743, a difference of 0.41%), Arapaho ($67,965, a difference of 0.73%), and Native/Alaskan ($67,879, a difference of 0.86%).
| Demographics | Rating | Rank | Median Household Income |
| Colville | 0.0 /100 | #320 | Tragic $70,094 |
| Chickasaw | 0.0 /100 | #321 | Tragic $70,005 |
| Choctaw | 0.0 /100 | #322 | Tragic $69,947 |
| Bahamians | 0.0 /100 | #323 | Tragic $69,726 |
| Yup'ik | 0.0 /100 | #324 | Tragic $69,695 |
| Seminole | 0.0 /100 | #325 | Tragic $69,420 |
| Yuman | 0.0 /100 | #326 | Tragic $68,743 |
| Immigrants | Cuba | 0.0 /100 | #327 | Tragic $68,461 |
| Menominee | 0.0 /100 | #328 | Tragic $68,423 |
| Dutch West Indians | 0.0 /100 | #329 | Tragic $68,412 |
| Arapaho | 0.0 /100 | #330 | Tragic $67,965 |
| Natives/Alaskans | 0.0 /100 | #331 | Tragic $67,879 |
| Sioux | 0.0 /100 | #332 | Tragic $67,792 |
| Creek | 0.0 /100 | #333 | Tragic $67,715 |
| Blacks/African Americans | 0.0 /100 | #334 | Tragic $67,573 |