Panamanian vs Colville Median Female Earnings
COMPARE
Panamanian
Colville
Median Female Earnings
Median Female Earnings Comparison
Panamanians
Colville
$39,049
MEDIAN FEMALE EARNINGS
20.6/ 100
METRIC RATING
201st/ 347
METRIC RANK
$37,514
MEDIAN FEMALE EARNINGS
1.1/ 100
METRIC RATING
255th/ 347
METRIC RANK
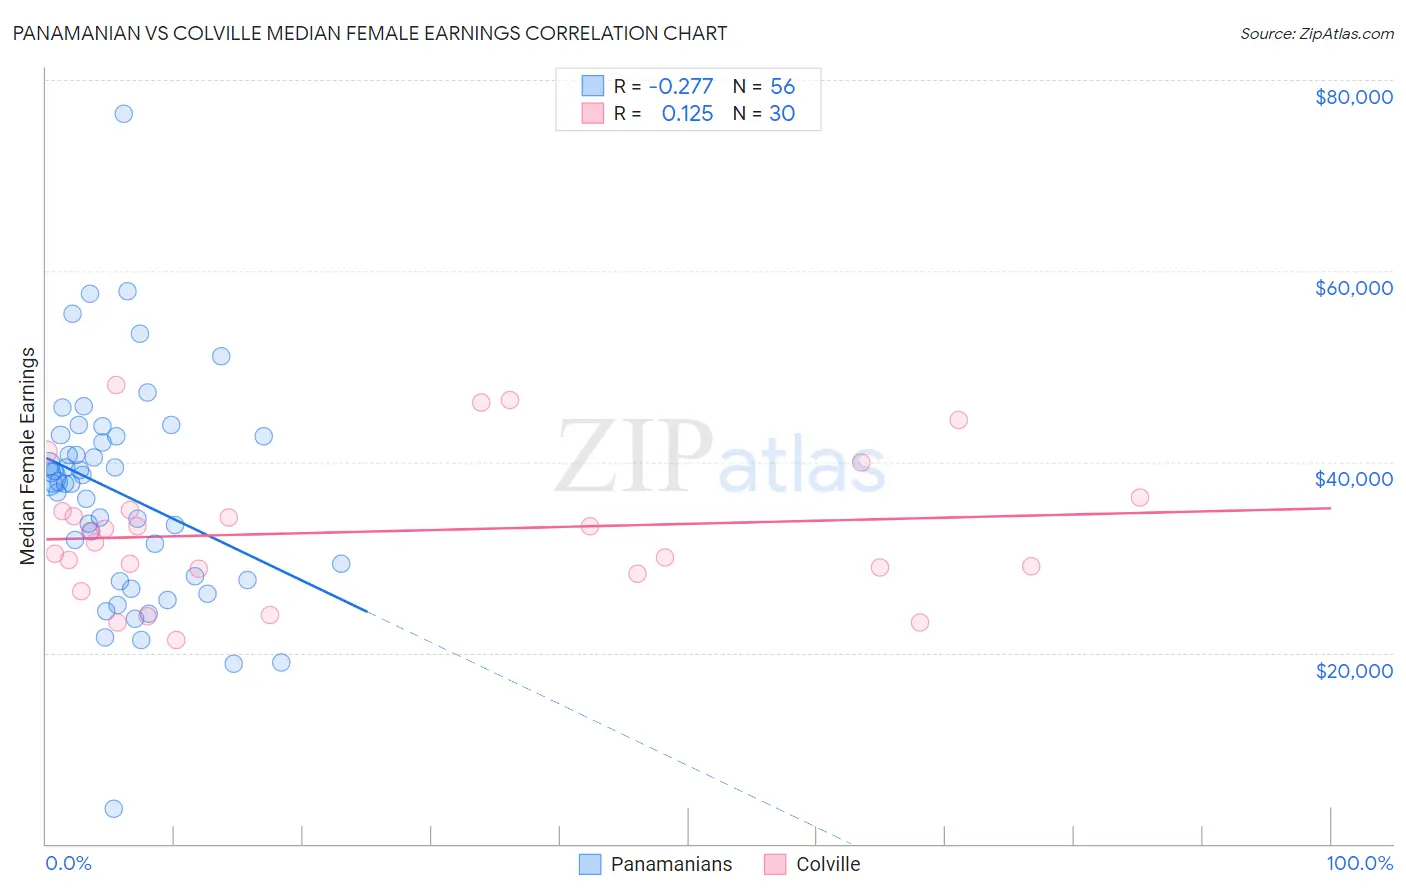
Panamanian vs Colville Median Female Earnings Correlation Chart
The statistical analysis conducted on geographies consisting of 281,178,776 people shows a weak negative correlation between the proportion of Panamanians and median female earnings in the United States with a correlation coefficient (R) of -0.277 and weighted average of $39,049. Similarly, the statistical analysis conducted on geographies consisting of 34,680,169 people shows a poor positive correlation between the proportion of Colville and median female earnings in the United States with a correlation coefficient (R) of 0.125 and weighted average of $37,514, a difference of 4.1%.
Median Female Earnings Correlation Summary
| Measurement | Panamanian | Colville |
| Minimum | $3,667 | $21,333 |
| Maximum | $76,443 | $48,065 |
| Range | $72,776 | $26,732 |
| Mean | $36,686 | $32,694 |
| Median | $37,828 | $32,120 |
| Interquartile 25% (IQ1) | $27,848 | $28,750 |
| Interquartile 75% (IQ3) | $42,686 | $34,898 |
| Interquartile Range (IQR) | $14,839 | $6,148 |
| Standard Deviation (Sample) | $11,684 | $7,179 |
| Standard Deviation (Population) | $11,579 | $7,058 |
Similar Demographics by Median Female Earnings
Demographics Similar to Panamanians by Median Female Earnings
In terms of median female earnings, the demographic groups most similar to Panamanians are Immigrants from Panama ($39,049, a difference of 0.0%), Slovak ($39,029, a difference of 0.050%), Icelander ($39,109, a difference of 0.15%), Czech ($38,992, a difference of 0.15%), and Ecuadorian ($39,117, a difference of 0.17%).
| Demographics | Rating | Rank | Median Female Earnings |
| Irish | 30.0 /100 | #194 | Fair $39,291 |
| Uruguayans | 27.3 /100 | #195 | Fair $39,228 |
| Immigrants | Costa Rica | 25.6 /100 | #196 | Fair $39,186 |
| Assyrians/Chaldeans/Syriacs | 24.6 /100 | #197 | Fair $39,159 |
| Ecuadorians | 23.0 /100 | #198 | Fair $39,117 |
| Icelanders | 22.7 /100 | #199 | Fair $39,109 |
| Immigrants | Panama | 20.6 /100 | #200 | Fair $39,049 |
| Panamanians | 20.6 /100 | #201 | Fair $39,049 |
| Slovaks | 19.9 /100 | #202 | Poor $39,029 |
| Czechs | 18.7 /100 | #203 | Poor $38,992 |
| Immigrants | Uruguay | 17.3 /100 | #204 | Poor $38,945 |
| Immigrants | Colombia | 16.3 /100 | #205 | Poor $38,913 |
| Immigrants | Bosnia and Herzegovina | 15.6 /100 | #206 | Poor $38,886 |
| Immigrants | Cambodia | 14.2 /100 | #207 | Poor $38,833 |
| Immigrants | Thailand | 13.6 /100 | #208 | Poor $38,810 |
Demographics Similar to Colville by Median Female Earnings
In terms of median female earnings, the demographic groups most similar to Colville are White/Caucasian ($37,531, a difference of 0.040%), Samoan ($37,498, a difference of 0.040%), Hawaiian ($37,497, a difference of 0.040%), Belizean ($37,429, a difference of 0.23%), and Scotch-Irish ($37,383, a difference of 0.35%).
| Demographics | Rating | Rank | Median Female Earnings |
| Alaskan Athabascans | 2.3 /100 | #248 | Tragic $37,905 |
| Swiss | 2.3 /100 | #249 | Tragic $37,904 |
| Immigrants | Iraq | 2.2 /100 | #250 | Tragic $37,864 |
| Welsh | 2.1 /100 | #251 | Tragic $37,856 |
| Immigrants | Dominica | 2.0 /100 | #252 | Tragic $37,825 |
| Danes | 1.6 /100 | #253 | Tragic $37,730 |
| Whites/Caucasians | 1.1 /100 | #254 | Tragic $37,531 |
| Colville | 1.1 /100 | #255 | Tragic $37,514 |
| Samoans | 1.0 /100 | #256 | Tragic $37,498 |
| Hawaiians | 1.0 /100 | #257 | Tragic $37,497 |
| Belizeans | 0.9 /100 | #258 | Tragic $37,429 |
| Scotch-Irish | 0.8 /100 | #259 | Tragic $37,383 |
| Dutch | 0.7 /100 | #260 | Tragic $37,339 |
| Malaysians | 0.7 /100 | #261 | Tragic $37,298 |
| Venezuelans | 0.7 /100 | #262 | Tragic $37,282 |