Immigrants from Venezuela vs Arapaho Per Capita Income
COMPARE
Immigrants from Venezuela
Arapaho
Per Capita Income
Per Capita Income Comparison
Immigrants from Venezuela
Arapaho
$41,727
PER CAPITA INCOME
10.2/ 100
METRIC RATING
213th/ 347
METRIC RANK
$32,345
PER CAPITA INCOME
0.0/ 100
METRIC RATING
338th/ 347
METRIC RANK
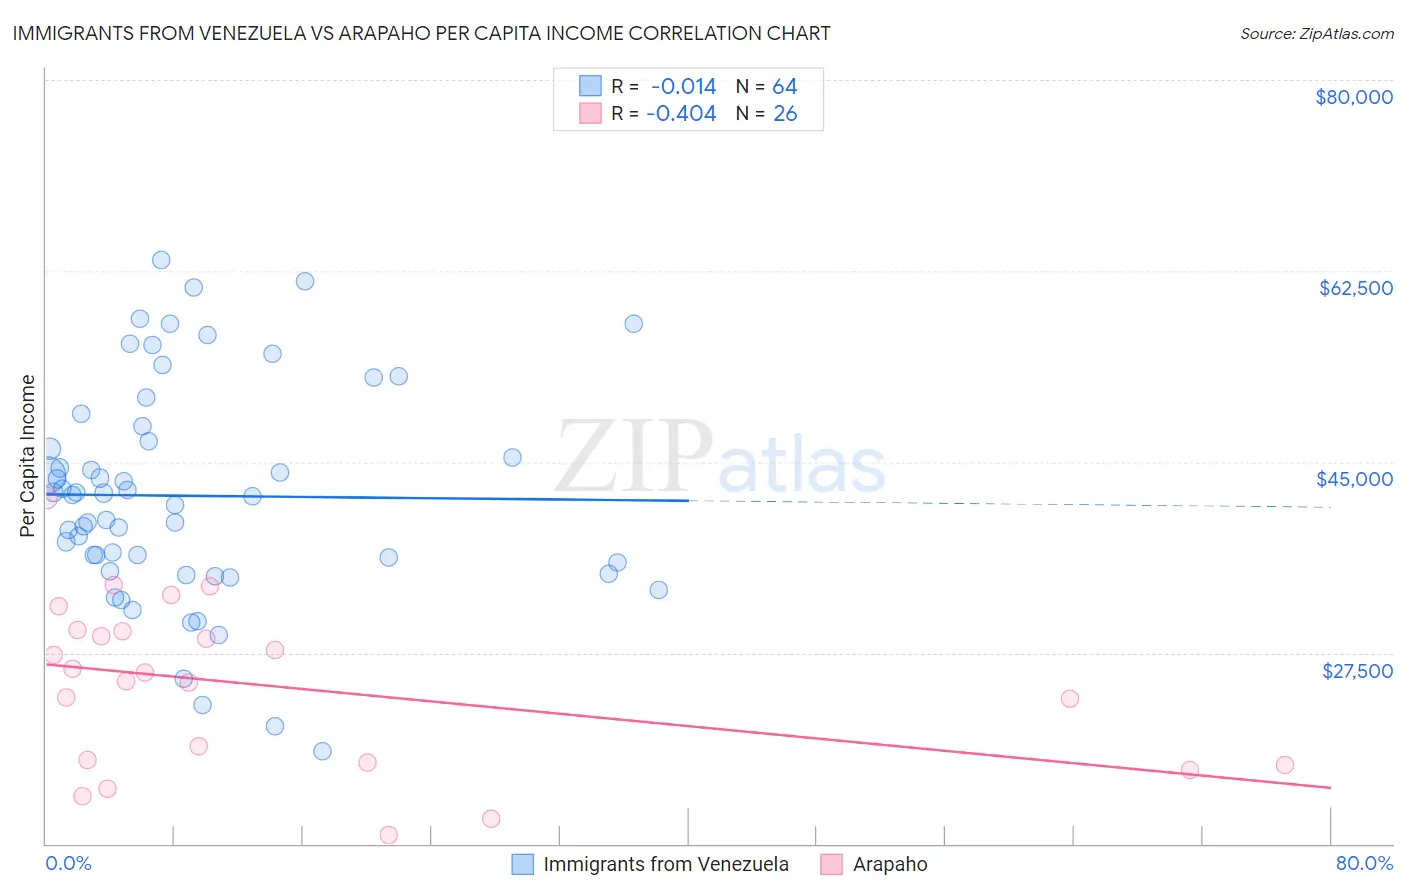
Immigrants from Venezuela vs Arapaho Per Capita Income Correlation Chart
The statistical analysis conducted on geographies consisting of 287,848,526 people shows no correlation between the proportion of Immigrants from Venezuela and per capita income in the United States with a correlation coefficient (R) of -0.014 and weighted average of $41,727. Similarly, the statistical analysis conducted on geographies consisting of 29,780,267 people shows a moderate negative correlation between the proportion of Arapaho and per capita income in the United States with a correlation coefficient (R) of -0.404 and weighted average of $32,345, a difference of 29.0%.
Per Capita Income Correlation Summary
| Measurement | Immigrants from Venezuela | Arapaho |
| Minimum | $18,497 | $10,798 |
| Maximum | $63,503 | $41,687 |
| Range | $45,006 | $30,889 |
| Mean | $41,894 | $24,378 |
| Median | $41,937 | $25,279 |
| Interquartile 25% (IQ1) | $35,384 | $17,440 |
| Interquartile 75% (IQ3) | $47,592 | $29,495 |
| Interquartile Range (IQR) | $12,208 | $12,055 |
| Standard Deviation (Sample) | $10,042 | $7,667 |
| Standard Deviation (Population) | $9,963 | $7,518 |
Similar Demographics by Per Capita Income
Demographics Similar to Immigrants from Venezuela by Per Capita Income
In terms of per capita income, the demographic groups most similar to Immigrants from Venezuela are Immigrants from Bangladesh ($41,709, a difference of 0.040%), Sudanese ($41,695, a difference of 0.080%), Tongan ($41,693, a difference of 0.080%), Guamanian/Chamorro ($41,678, a difference of 0.12%), and Trinidadian and Tobagonian ($41,655, a difference of 0.17%).
| Demographics | Rating | Rank | Per Capita Income |
| Ghanaians | 15.7 /100 | #206 | Poor $42,164 |
| Venezuelans | 14.4 /100 | #207 | Poor $42,074 |
| Panamanians | 13.9 /100 | #208 | Poor $42,035 |
| Immigrants | Sudan | 13.2 /100 | #209 | Poor $41,986 |
| Ecuadorians | 12.9 /100 | #210 | Poor $41,958 |
| Immigrants | Panama | 11.6 /100 | #211 | Poor $41,853 |
| Immigrants | Senegal | 11.3 /100 | #212 | Poor $41,830 |
| Immigrants | Venezuela | 10.2 /100 | #213 | Poor $41,727 |
| Immigrants | Bangladesh | 10.1 /100 | #214 | Poor $41,709 |
| Sudanese | 9.9 /100 | #215 | Tragic $41,695 |
| Tongans | 9.9 /100 | #216 | Tragic $41,693 |
| Guamanians/Chamorros | 9.7 /100 | #217 | Tragic $41,678 |
| Trinidadians and Tobagonians | 9.5 /100 | #218 | Tragic $41,655 |
| Puget Sound Salish | 8.1 /100 | #219 | Tragic $41,495 |
| Immigrants | Barbados | 7.9 /100 | #220 | Tragic $41,478 |
Demographics Similar to Arapaho by Per Capita Income
In terms of per capita income, the demographic groups most similar to Arapaho are Pueblo ($32,012, a difference of 1.0%), Crow ($31,729, a difference of 1.9%), Houma ($32,996, a difference of 2.0%), Yakama ($33,009, a difference of 2.1%), and Yuman ($33,236, a difference of 2.8%).
| Demographics | Rating | Rank | Per Capita Income |
| Immigrants | Mexico | 0.0 /100 | #331 | Tragic $33,931 |
| Sioux | 0.0 /100 | #332 | Tragic $33,921 |
| Immigrants | Yemen | 0.0 /100 | #333 | Tragic $33,696 |
| Natives/Alaskans | 0.0 /100 | #334 | Tragic $33,279 |
| Yuman | 0.0 /100 | #335 | Tragic $33,236 |
| Yakama | 0.0 /100 | #336 | Tragic $33,009 |
| Houma | 0.0 /100 | #337 | Tragic $32,996 |
| Arapaho | 0.0 /100 | #338 | Tragic $32,345 |
| Pueblo | 0.0 /100 | #339 | Tragic $32,012 |
| Crow | 0.0 /100 | #340 | Tragic $31,729 |
| Puerto Ricans | 0.0 /100 | #341 | Tragic $31,268 |
| Hopi | 0.0 /100 | #342 | Tragic $31,177 |
| Pima | 0.0 /100 | #343 | Tragic $30,644 |
| Yup'ik | 0.0 /100 | #344 | Tragic $30,518 |
| Tohono O'odham | 0.0 /100 | #345 | Tragic $30,256 |