Immigrants from Nicaragua vs Cheyenne Median Family Income
COMPARE
Immigrants from Nicaragua
Cheyenne
Median Family Income
Median Family Income Comparison
Immigrants from Nicaragua
Cheyenne
$88,267
MEDIAN FAMILY INCOME
0.1/ 100
METRIC RATING
286th/ 347
METRIC RANK
$81,385
MEDIAN FAMILY INCOME
0.0/ 100
METRIC RATING
330th/ 347
METRIC RANK
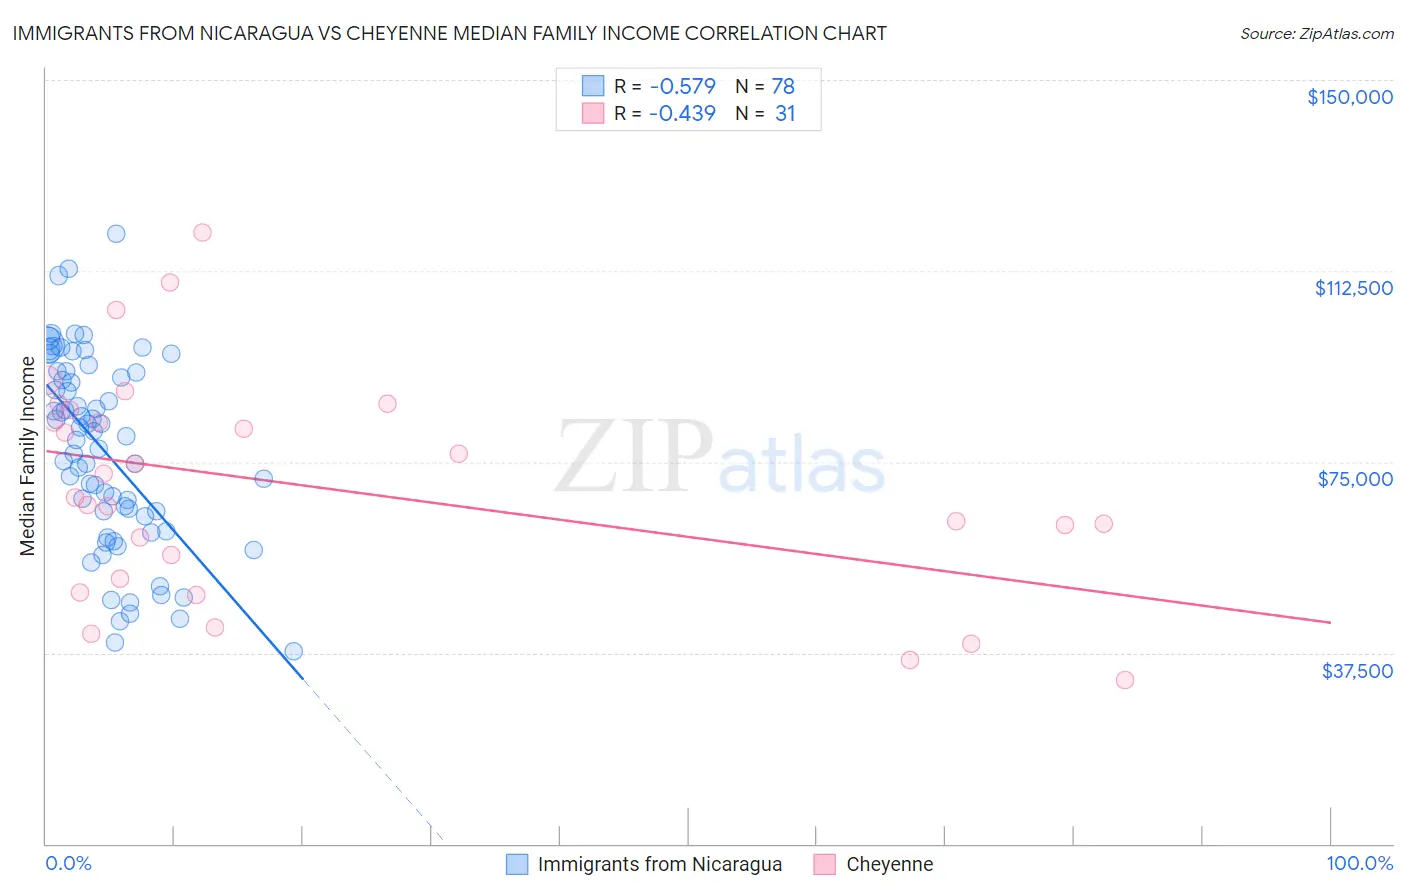
Immigrants from Nicaragua vs Cheyenne Median Family Income Correlation Chart
The statistical analysis conducted on geographies consisting of 236,310,703 people shows a substantial negative correlation between the proportion of Immigrants from Nicaragua and median family income in the United States with a correlation coefficient (R) of -0.579 and weighted average of $88,267. Similarly, the statistical analysis conducted on geographies consisting of 80,698,521 people shows a moderate negative correlation between the proportion of Cheyenne and median family income in the United States with a correlation coefficient (R) of -0.439 and weighted average of $81,385, a difference of 8.5%.
Median Family Income Correlation Summary
| Measurement | Immigrants from Nicaragua | Cheyenne |
| Minimum | $37,806 | $32,159 |
| Maximum | $119,688 | $120,128 |
| Range | $81,882 | $87,969 |
| Mean | $77,073 | $70,077 |
| Median | $79,725 | $67,927 |
| Interquartile 25% (IQ1) | $64,231 | $52,031 |
| Interquartile 75% (IQ3) | $92,500 | $85,161 |
| Interquartile Range (IQR) | $28,269 | $33,130 |
| Standard Deviation (Sample) | $18,710 | $21,843 |
| Standard Deviation (Population) | $18,590 | $21,488 |
Similar Demographics by Median Family Income
Demographics Similar to Immigrants from Nicaragua by Median Family Income
In terms of median family income, the demographic groups most similar to Immigrants from Nicaragua are Potawatomi ($88,265, a difference of 0.0%), Guatemalan ($88,295, a difference of 0.030%), Indonesian ($88,301, a difference of 0.040%), Cherokee ($88,209, a difference of 0.070%), and Bangladeshi ($88,358, a difference of 0.10%).
| Demographics | Rating | Rank | Median Family Income |
| Immigrants | Belize | 0.1 /100 | #279 | Tragic $89,197 |
| British West Indians | 0.1 /100 | #280 | Tragic $88,987 |
| Blackfeet | 0.1 /100 | #281 | Tragic $88,717 |
| Comanche | 0.1 /100 | #282 | Tragic $88,556 |
| Bangladeshis | 0.1 /100 | #283 | Tragic $88,358 |
| Indonesians | 0.1 /100 | #284 | Tragic $88,301 |
| Guatemalans | 0.1 /100 | #285 | Tragic $88,295 |
| Immigrants | Nicaragua | 0.1 /100 | #286 | Tragic $88,267 |
| Potawatomi | 0.1 /100 | #287 | Tragic $88,265 |
| Cherokee | 0.1 /100 | #288 | Tragic $88,209 |
| Central American Indians | 0.1 /100 | #289 | Tragic $88,034 |
| Shoshone | 0.1 /100 | #290 | Tragic $87,872 |
| Immigrants | Cabo Verde | 0.1 /100 | #291 | Tragic $87,830 |
| Africans | 0.1 /100 | #292 | Tragic $87,820 |
| Ute | 0.0 /100 | #293 | Tragic $87,596 |
Demographics Similar to Cheyenne by Median Family Income
In terms of median family income, the demographic groups most similar to Cheyenne are Immigrants from Dominican Republic ($81,233, a difference of 0.19%), Dutch West Indian ($81,852, a difference of 0.57%), Native/Alaskan ($80,908, a difference of 0.59%), Kiowa ($80,885, a difference of 0.62%), and Black/African American ($81,912, a difference of 0.65%).
| Demographics | Rating | Rank | Median Family Income |
| Bahamians | 0.0 /100 | #323 | Tragic $82,631 |
| Creek | 0.0 /100 | #324 | Tragic $82,560 |
| Sioux | 0.0 /100 | #325 | Tragic $82,386 |
| Immigrants | Congo | 0.0 /100 | #326 | Tragic $82,216 |
| Arapaho | 0.0 /100 | #327 | Tragic $82,064 |
| Blacks/African Americans | 0.0 /100 | #328 | Tragic $81,912 |
| Dutch West Indians | 0.0 /100 | #329 | Tragic $81,852 |
| Cheyenne | 0.0 /100 | #330 | Tragic $81,385 |
| Immigrants | Dominican Republic | 0.0 /100 | #331 | Tragic $81,233 |
| Natives/Alaskans | 0.0 /100 | #332 | Tragic $80,908 |
| Kiowa | 0.0 /100 | #333 | Tragic $80,885 |
| Menominee | 0.0 /100 | #334 | Tragic $79,563 |
| Yup'ik | 0.0 /100 | #335 | Tragic $79,290 |
| Immigrants | Cuba | 0.0 /100 | #336 | Tragic $78,249 |
| Yuman | 0.0 /100 | #337 | Tragic $78,055 |