Immigrants from Latin America vs Native Hawaiian Median Female Earnings
COMPARE
Immigrants from Latin America
Native Hawaiian
Median Female Earnings
Median Female Earnings Comparison
Immigrants from Latin America
Native Hawaiians
$35,307
MEDIAN FEMALE EARNINGS
0.0/ 100
METRIC RATING
303rd/ 347
METRIC RANK
$38,461
MEDIAN FEMALE EARNINGS
7.1/ 100
METRIC RATING
224th/ 347
METRIC RANK
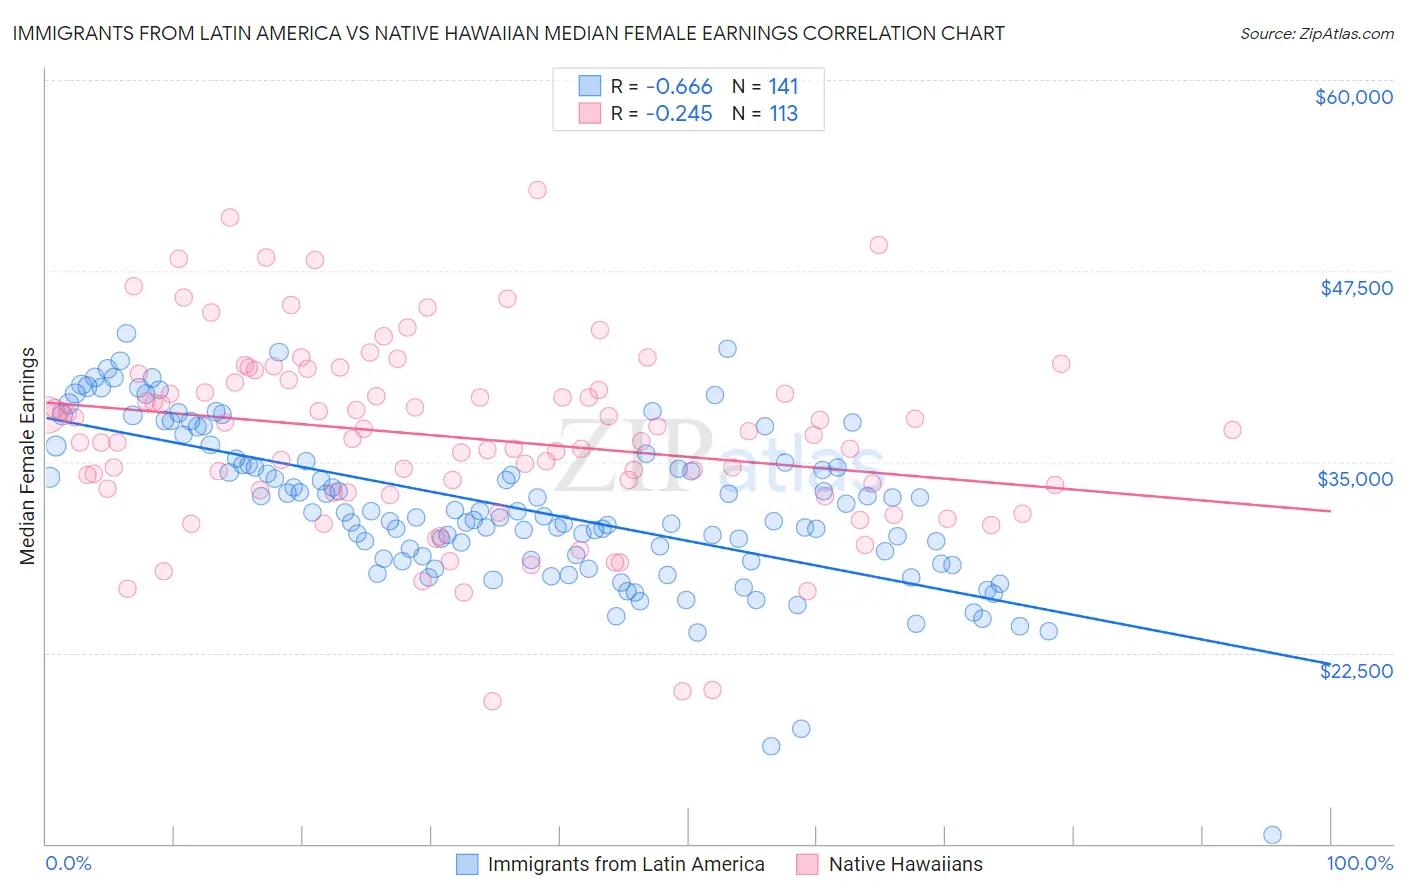
Immigrants from Latin America vs Native Hawaiian Median Female Earnings Correlation Chart
The statistical analysis conducted on geographies consisting of 557,242,268 people shows a significant negative correlation between the proportion of Immigrants from Latin America and median female earnings in the United States with a correlation coefficient (R) of -0.666 and weighted average of $35,307. Similarly, the statistical analysis conducted on geographies consisting of 331,982,938 people shows a weak negative correlation between the proportion of Native Hawaiians and median female earnings in the United States with a correlation coefficient (R) of -0.245 and weighted average of $38,461, a difference of 8.9%.
Median Female Earnings Correlation Summary
| Measurement | Immigrants from Latin America | Native Hawaiian |
| Minimum | $10,532 | $19,330 |
| Maximum | $43,408 | $52,779 |
| Range | $32,876 | $33,449 |
| Mean | $32,057 | $36,634 |
| Median | $31,685 | $36,735 |
| Interquartile 25% (IQ1) | $28,590 | $33,052 |
| Interquartile 75% (IQ3) | $35,130 | $40,312 |
| Interquartile Range (IQR) | $6,540 | $7,259 |
| Standard Deviation (Sample) | $5,280 | $6,153 |
| Standard Deviation (Population) | $5,261 | $6,125 |
Similar Demographics by Median Female Earnings
Demographics Similar to Immigrants from Latin America by Median Female Earnings
In terms of median female earnings, the demographic groups most similar to Immigrants from Latin America are Black/African American ($35,315, a difference of 0.020%), Pima ($35,326, a difference of 0.050%), Crow ($35,266, a difference of 0.11%), Yuman ($35,377, a difference of 0.20%), and Immigrants from Guatemala ($35,444, a difference of 0.39%).
| Demographics | Rating | Rank | Median Female Earnings |
| Mexican American Indians | 0.0 /100 | #296 | Tragic $35,629 |
| Hmong | 0.0 /100 | #297 | Tragic $35,498 |
| Immigrants | Micronesia | 0.0 /100 | #298 | Tragic $35,477 |
| Immigrants | Guatemala | 0.0 /100 | #299 | Tragic $35,444 |
| Yuman | 0.0 /100 | #300 | Tragic $35,377 |
| Pima | 0.0 /100 | #301 | Tragic $35,326 |
| Blacks/African Americans | 0.0 /100 | #302 | Tragic $35,315 |
| Immigrants | Latin America | 0.0 /100 | #303 | Tragic $35,307 |
| Crow | 0.0 /100 | #304 | Tragic $35,266 |
| Bahamians | 0.0 /100 | #305 | Tragic $35,125 |
| Fijians | 0.0 /100 | #306 | Tragic $35,114 |
| Sioux | 0.0 /100 | #307 | Tragic $35,063 |
| Immigrants | Bahamas | 0.0 /100 | #308 | Tragic $35,027 |
| Hondurans | 0.0 /100 | #309 | Tragic $35,013 |
| Chippewa | 0.0 /100 | #310 | Tragic $35,003 |
Demographics Similar to Native Hawaiians by Median Female Earnings
In terms of median female earnings, the demographic groups most similar to Native Hawaiians are French ($38,457, a difference of 0.010%), French Canadian ($38,436, a difference of 0.060%), Immigrants from Sudan ($38,511, a difference of 0.13%), Japanese ($38,528, a difference of 0.17%), and Scottish ($38,397, a difference of 0.17%).
| Demographics | Rating | Rank | Median Female Earnings |
| Immigrants | Jamaica | 9.7 /100 | #217 | Tragic $38,625 |
| Cape Verdeans | 9.5 /100 | #218 | Tragic $38,614 |
| Nepalese | 9.3 /100 | #219 | Tragic $38,603 |
| Yugoslavians | 8.8 /100 | #220 | Tragic $38,573 |
| Immigrants | Azores | 8.8 /100 | #221 | Tragic $38,573 |
| Japanese | 8.1 /100 | #222 | Tragic $38,528 |
| Immigrants | Sudan | 7.8 /100 | #223 | Tragic $38,511 |
| Native Hawaiians | 7.1 /100 | #224 | Tragic $38,461 |
| French | 7.0 /100 | #225 | Tragic $38,457 |
| French Canadians | 6.8 /100 | #226 | Tragic $38,436 |
| Scottish | 6.3 /100 | #227 | Tragic $38,397 |
| Sub-Saharan Africans | 6.2 /100 | #228 | Tragic $38,391 |
| Belgians | 6.1 /100 | #229 | Tragic $38,382 |
| Basques | 5.7 /100 | #230 | Tragic $38,352 |
| Somalis | 5.5 /100 | #231 | Tragic $38,333 |