Dutch West Indian vs Cajun Median Family Income
COMPARE
Dutch West Indian
Cajun
Median Family Income
Median Family Income Comparison
Dutch West Indians
Cajuns
$81,852
MEDIAN FAMILY INCOME
0.0/ 100
METRIC RATING
329th/ 347
METRIC RANK
$87,157
MEDIAN FAMILY INCOME
0.0/ 100
METRIC RATING
297th/ 347
METRIC RANK
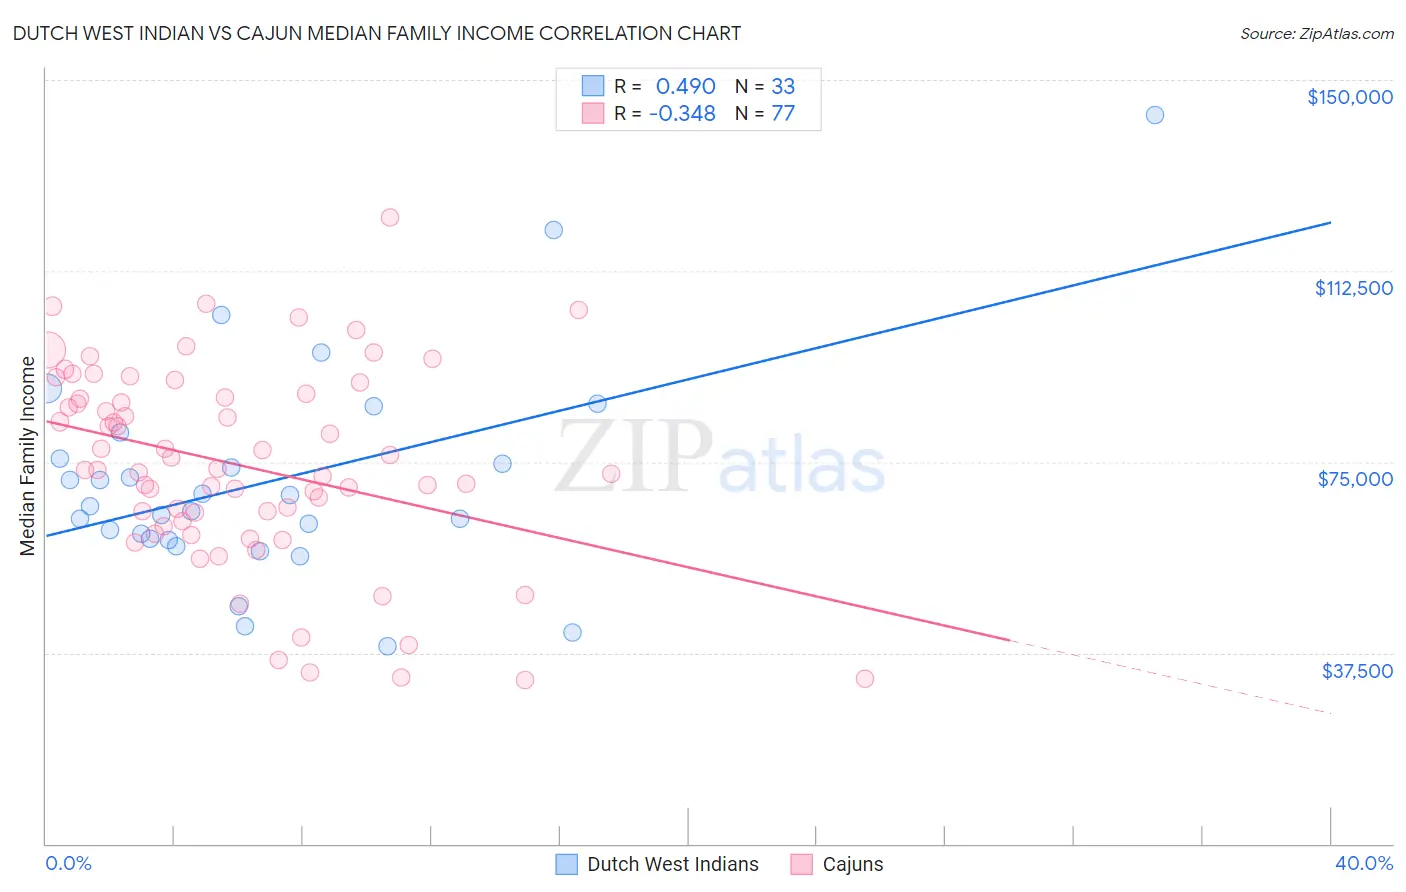
Dutch West Indian vs Cajun Median Family Income Correlation Chart
The statistical analysis conducted on geographies consisting of 85,761,161 people shows a moderate positive correlation between the proportion of Dutch West Indians and median family income in the United States with a correlation coefficient (R) of 0.490 and weighted average of $81,852. Similarly, the statistical analysis conducted on geographies consisting of 149,670,371 people shows a mild negative correlation between the proportion of Cajuns and median family income in the United States with a correlation coefficient (R) of -0.348 and weighted average of $87,157, a difference of 6.5%.
Median Family Income Correlation Summary
| Measurement | Dutch West Indian | Cajun |
| Minimum | $38,750 | $32,222 |
| Maximum | $143,036 | $122,896 |
| Range | $104,286 | $90,674 |
| Mean | $71,323 | $74,286 |
| Median | $66,291 | $73,392 |
| Interquartile 25% (IQ1) | $59,737 | $62,875 |
| Interquartile 75% (IQ3) | $78,266 | $88,056 |
| Interquartile Range (IQR) | $18,529 | $25,181 |
| Standard Deviation (Sample) | $21,583 | $19,414 |
| Standard Deviation (Population) | $21,254 | $19,288 |
Similar Demographics by Median Family Income
Demographics Similar to Dutch West Indians by Median Family Income
In terms of median family income, the demographic groups most similar to Dutch West Indians are Black/African American ($81,912, a difference of 0.070%), Arapaho ($82,064, a difference of 0.26%), Immigrants from Congo ($82,216, a difference of 0.45%), Cheyenne ($81,385, a difference of 0.57%), and Sioux ($82,386, a difference of 0.65%).
| Demographics | Rating | Rank | Median Family Income |
| Dominicans | 0.0 /100 | #322 | Tragic $82,888 |
| Bahamians | 0.0 /100 | #323 | Tragic $82,631 |
| Creek | 0.0 /100 | #324 | Tragic $82,560 |
| Sioux | 0.0 /100 | #325 | Tragic $82,386 |
| Immigrants | Congo | 0.0 /100 | #326 | Tragic $82,216 |
| Arapaho | 0.0 /100 | #327 | Tragic $82,064 |
| Blacks/African Americans | 0.0 /100 | #328 | Tragic $81,912 |
| Dutch West Indians | 0.0 /100 | #329 | Tragic $81,852 |
| Cheyenne | 0.0 /100 | #330 | Tragic $81,385 |
| Immigrants | Dominican Republic | 0.0 /100 | #331 | Tragic $81,233 |
| Natives/Alaskans | 0.0 /100 | #332 | Tragic $80,908 |
| Kiowa | 0.0 /100 | #333 | Tragic $80,885 |
| Menominee | 0.0 /100 | #334 | Tragic $79,563 |
| Yup'ik | 0.0 /100 | #335 | Tragic $79,290 |
| Immigrants | Cuba | 0.0 /100 | #336 | Tragic $78,249 |
Demographics Similar to Cajuns by Median Family Income
In terms of median family income, the demographic groups most similar to Cajuns are Immigrants from Guatemala ($87,191, a difference of 0.040%), Yaqui ($87,289, a difference of 0.15%), Immigrants from Latin America ($86,989, a difference of 0.19%), Fijian ($87,387, a difference of 0.26%), and Chippewa ($86,852, a difference of 0.35%).
| Demographics | Rating | Rank | Median Family Income |
| Shoshone | 0.1 /100 | #290 | Tragic $87,872 |
| Immigrants | Cabo Verde | 0.1 /100 | #291 | Tragic $87,830 |
| Africans | 0.1 /100 | #292 | Tragic $87,820 |
| Ute | 0.0 /100 | #293 | Tragic $87,596 |
| Fijians | 0.0 /100 | #294 | Tragic $87,387 |
| Yaqui | 0.0 /100 | #295 | Tragic $87,289 |
| Immigrants | Guatemala | 0.0 /100 | #296 | Tragic $87,191 |
| Cajuns | 0.0 /100 | #297 | Tragic $87,157 |
| Immigrants | Latin America | 0.0 /100 | #298 | Tragic $86,989 |
| Chippewa | 0.0 /100 | #299 | Tragic $86,852 |
| Ottawa | 0.0 /100 | #300 | Tragic $86,380 |
| Colville | 0.0 /100 | #301 | Tragic $85,792 |
| Spanish American Indians | 0.0 /100 | #302 | Tragic $85,728 |
| Hispanics or Latinos | 0.0 /100 | #303 | Tragic $85,647 |
| Mexicans | 0.0 /100 | #304 | Tragic $85,618 |