Cuban vs Immigrants from Vietnam Median Female Earnings
COMPARE
Cuban
Immigrants from Vietnam
Median Female Earnings
Median Female Earnings Comparison
Cubans
Immigrants from Vietnam
$34,942
MEDIAN FEMALE EARNINGS
0.0/ 100
METRIC RATING
313th/ 347
METRIC RANK
$40,153
MEDIAN FEMALE EARNINGS
72.0/ 100
METRIC RATING
159th/ 347
METRIC RANK
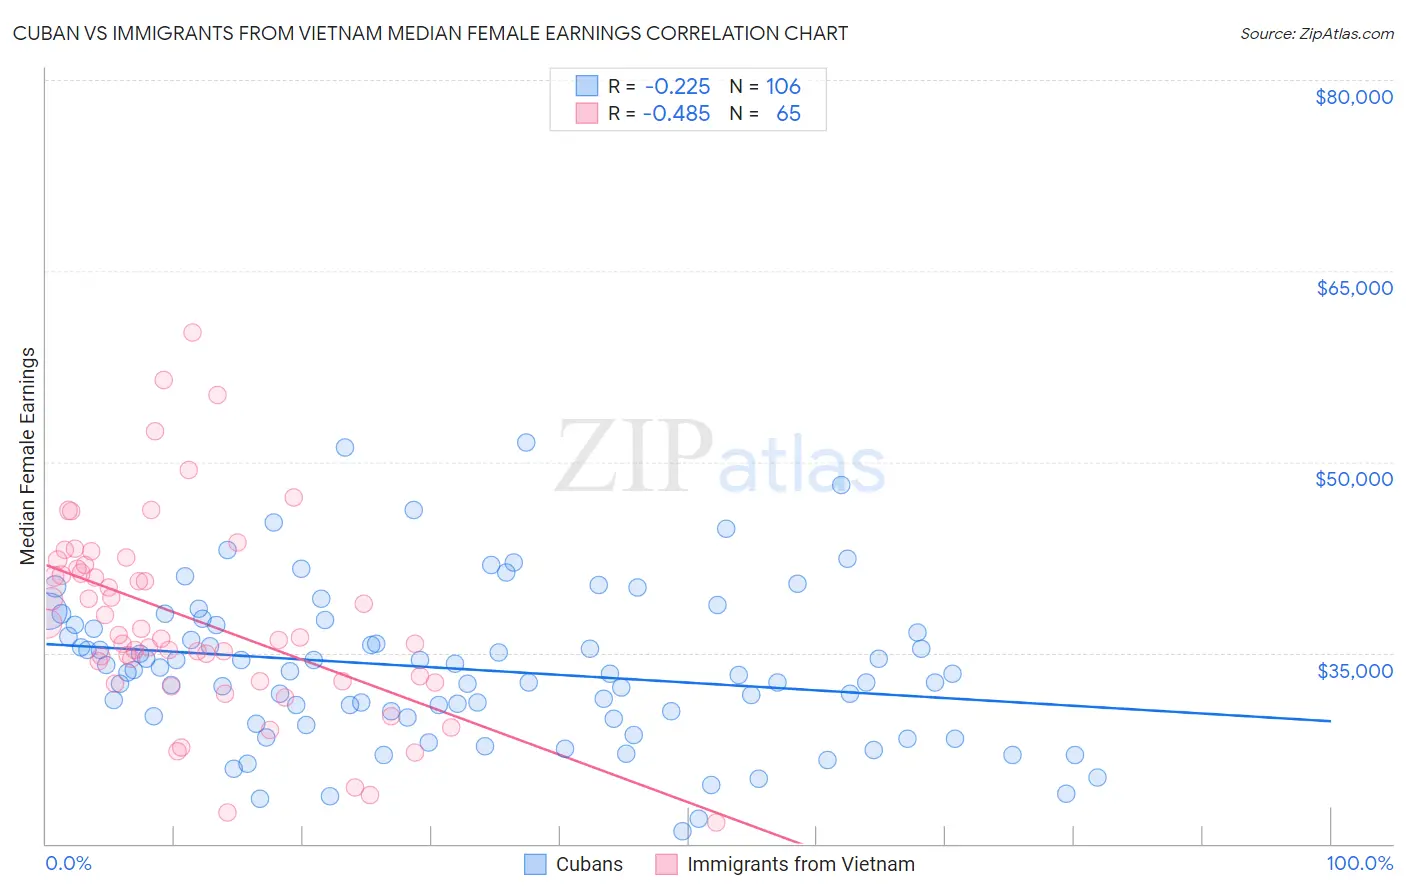
Cuban vs Immigrants from Vietnam Median Female Earnings Correlation Chart
The statistical analysis conducted on geographies consisting of 449,056,362 people shows a weak negative correlation between the proportion of Cubans and median female earnings in the United States with a correlation coefficient (R) of -0.225 and weighted average of $34,942. Similarly, the statistical analysis conducted on geographies consisting of 404,736,048 people shows a moderate negative correlation between the proportion of Immigrants from Vietnam and median female earnings in the United States with a correlation coefficient (R) of -0.485 and weighted average of $40,153, a difference of 14.9%.
Median Female Earnings Correlation Summary
| Measurement | Cuban | Immigrants from Vietnam |
| Minimum | $20,938 | $21,667 |
| Maximum | $51,542 | $60,178 |
| Range | $30,604 | $38,511 |
| Mean | $33,741 | $37,583 |
| Median | $33,424 | $36,210 |
| Interquartile 25% (IQ1) | $29,890 | $32,746 |
| Interquartile 75% (IQ3) | $37,174 | $41,762 |
| Interquartile Range (IQR) | $7,284 | $9,017 |
| Standard Deviation (Sample) | $5,986 | $7,711 |
| Standard Deviation (Population) | $5,958 | $7,652 |
Similar Demographics by Median Female Earnings
Demographics Similar to Cubans by Median Female Earnings
In terms of median female earnings, the demographic groups most similar to Cubans are Yaqui ($34,943, a difference of 0.0%), Ute ($34,960, a difference of 0.050%), Apache ($34,895, a difference of 0.13%), Chippewa ($35,003, a difference of 0.17%), and Honduran ($35,013, a difference of 0.20%).
| Demographics | Rating | Rank | Median Female Earnings |
| Fijians | 0.0 /100 | #306 | Tragic $35,114 |
| Sioux | 0.0 /100 | #307 | Tragic $35,063 |
| Immigrants | Bahamas | 0.0 /100 | #308 | Tragic $35,027 |
| Hondurans | 0.0 /100 | #309 | Tragic $35,013 |
| Chippewa | 0.0 /100 | #310 | Tragic $35,003 |
| Ute | 0.0 /100 | #311 | Tragic $34,960 |
| Yaqui | 0.0 /100 | #312 | Tragic $34,943 |
| Cubans | 0.0 /100 | #313 | Tragic $34,942 |
| Apache | 0.0 /100 | #314 | Tragic $34,895 |
| Pennsylvania Germans | 0.0 /100 | #315 | Tragic $34,802 |
| Cherokee | 0.0 /100 | #316 | Tragic $34,742 |
| Potawatomi | 0.0 /100 | #317 | Tragic $34,739 |
| Immigrants | Yemen | 0.0 /100 | #318 | Tragic $34,693 |
| Shoshone | 0.0 /100 | #319 | Tragic $34,677 |
| Immigrants | Honduras | 0.0 /100 | #320 | Tragic $34,647 |
Demographics Similar to Immigrants from Vietnam by Median Female Earnings
In terms of median female earnings, the demographic groups most similar to Immigrants from Vietnam are Immigrants from Senegal ($40,157, a difference of 0.010%), Portuguese ($40,177, a difference of 0.060%), Inupiat ($40,080, a difference of 0.18%), Peruvian ($40,234, a difference of 0.20%), and Alsatian ($40,060, a difference of 0.23%).
| Demographics | Rating | Rank | Median Female Earnings |
| West Indians | 78.4 /100 | #152 | Good $40,317 |
| British West Indians | 77.7 /100 | #153 | Good $40,299 |
| Immigrants | Oceania | 77.6 /100 | #154 | Good $40,297 |
| Immigrants | Africa | 76.2 /100 | #155 | Good $40,257 |
| Peruvians | 75.3 /100 | #156 | Good $40,234 |
| Portuguese | 73.0 /100 | #157 | Good $40,177 |
| Immigrants | Senegal | 72.2 /100 | #158 | Good $40,157 |
| Immigrants | Vietnam | 72.0 /100 | #159 | Good $40,153 |
| Inupiat | 68.9 /100 | #160 | Good $40,080 |
| Alsatians | 68.0 /100 | #161 | Good $40,060 |
| South American Indians | 66.1 /100 | #162 | Good $40,019 |
| Lebanese | 65.5 /100 | #163 | Good $40,006 |
| Immigrants | Saudi Arabia | 62.9 /100 | #164 | Good $39,952 |
| Immigrants | Bangladesh | 60.8 /100 | #165 | Good $39,910 |
| Immigrants | Ghana | 60.0 /100 | #166 | Good $39,894 |