Cuban vs Puget Sound Salish Median Female Earnings
COMPARE
Cuban
Puget Sound Salish
Median Female Earnings
Median Female Earnings Comparison
Cubans
Puget Sound Salish
$34,942
MEDIAN FEMALE EARNINGS
0.0/ 100
METRIC RATING
313th/ 347
METRIC RANK
$39,376
MEDIAN FEMALE EARNINGS
33.9/ 100
METRIC RATING
190th/ 347
METRIC RANK
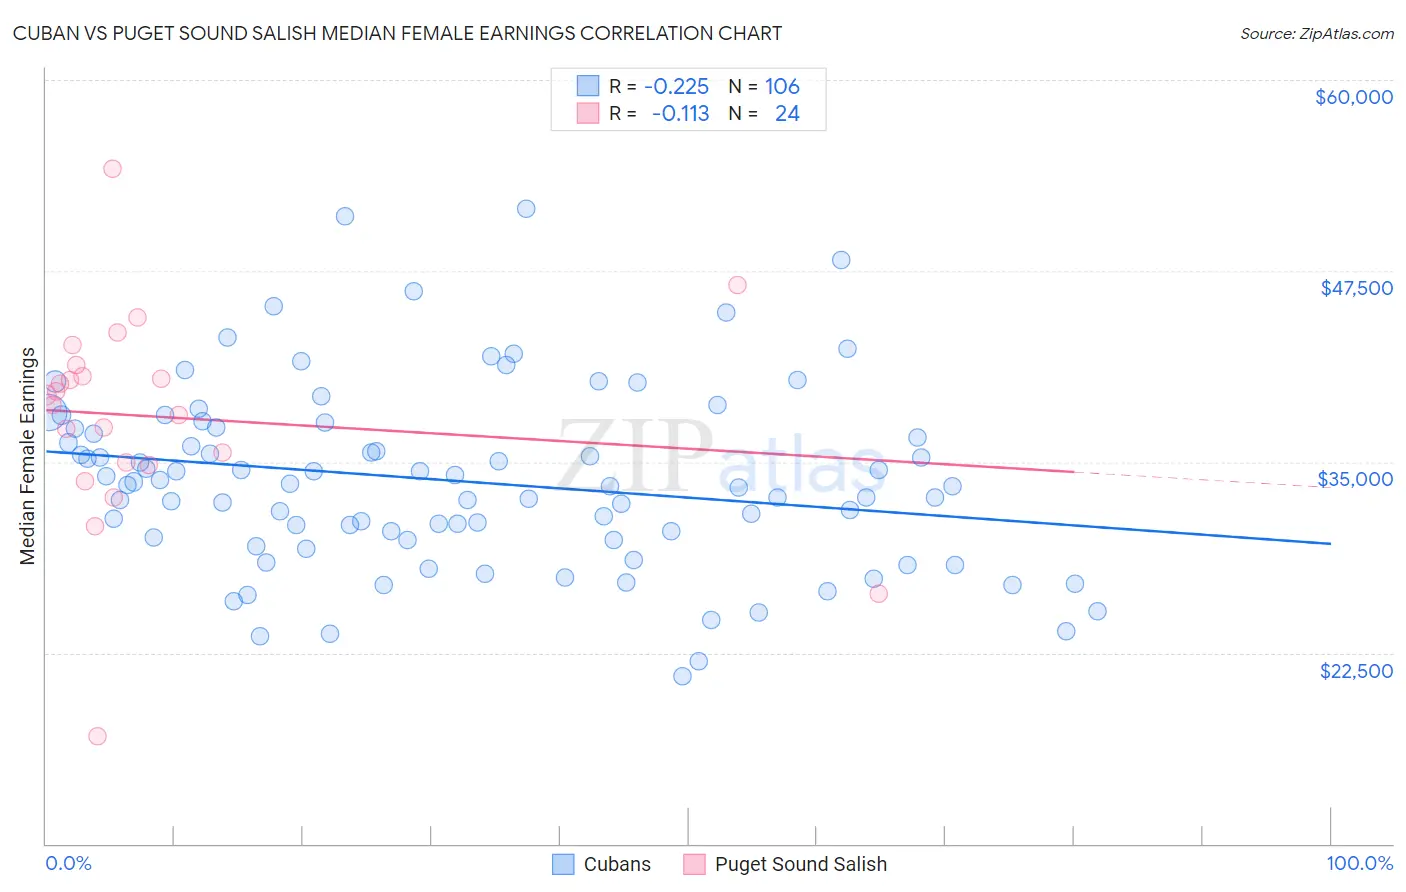
Cuban vs Puget Sound Salish Median Female Earnings Correlation Chart
The statistical analysis conducted on geographies consisting of 449,056,362 people shows a weak negative correlation between the proportion of Cubans and median female earnings in the United States with a correlation coefficient (R) of -0.225 and weighted average of $34,942. Similarly, the statistical analysis conducted on geographies consisting of 46,146,789 people shows a poor negative correlation between the proportion of Puget Sound Salish and median female earnings in the United States with a correlation coefficient (R) of -0.113 and weighted average of $39,376, a difference of 12.7%.
Median Female Earnings Correlation Summary
| Measurement | Cuban | Puget Sound Salish |
| Minimum | $20,938 | $17,028 |
| Maximum | $51,542 | $54,167 |
| Range | $30,604 | $37,139 |
| Mean | $33,741 | $37,933 |
| Median | $33,424 | $39,067 |
| Interquartile 25% (IQ1) | $29,890 | $34,884 |
| Interquartile 75% (IQ3) | $37,174 | $40,976 |
| Interquartile Range (IQR) | $7,284 | $6,092 |
| Standard Deviation (Sample) | $5,986 | $7,122 |
| Standard Deviation (Population) | $5,958 | $6,972 |
Similar Demographics by Median Female Earnings
Demographics Similar to Cubans by Median Female Earnings
In terms of median female earnings, the demographic groups most similar to Cubans are Yaqui ($34,943, a difference of 0.0%), Ute ($34,960, a difference of 0.050%), Apache ($34,895, a difference of 0.13%), Chippewa ($35,003, a difference of 0.17%), and Honduran ($35,013, a difference of 0.20%).
| Demographics | Rating | Rank | Median Female Earnings |
| Fijians | 0.0 /100 | #306 | Tragic $35,114 |
| Sioux | 0.0 /100 | #307 | Tragic $35,063 |
| Immigrants | Bahamas | 0.0 /100 | #308 | Tragic $35,027 |
| Hondurans | 0.0 /100 | #309 | Tragic $35,013 |
| Chippewa | 0.0 /100 | #310 | Tragic $35,003 |
| Ute | 0.0 /100 | #311 | Tragic $34,960 |
| Yaqui | 0.0 /100 | #312 | Tragic $34,943 |
| Cubans | 0.0 /100 | #313 | Tragic $34,942 |
| Apache | 0.0 /100 | #314 | Tragic $34,895 |
| Pennsylvania Germans | 0.0 /100 | #315 | Tragic $34,802 |
| Cherokee | 0.0 /100 | #316 | Tragic $34,742 |
| Potawatomi | 0.0 /100 | #317 | Tragic $34,739 |
| Immigrants | Yemen | 0.0 /100 | #318 | Tragic $34,693 |
| Shoshone | 0.0 /100 | #319 | Tragic $34,677 |
| Immigrants | Honduras | 0.0 /100 | #320 | Tragic $34,647 |
Demographics Similar to Puget Sound Salish by Median Female Earnings
In terms of median female earnings, the demographic groups most similar to Puget Sound Salish are Senegalese ($39,384, a difference of 0.020%), Immigrants from Western Africa ($39,351, a difference of 0.060%), Swedish ($39,421, a difference of 0.11%), Bermudan ($39,418, a difference of 0.11%), and Immigrants ($39,328, a difference of 0.12%).
| Demographics | Rating | Rank | Median Female Earnings |
| Hungarians | 40.3 /100 | #183 | Average $39,510 |
| Europeans | 37.7 /100 | #184 | Fair $39,457 |
| Immigrants | West Indies | 36.9 /100 | #185 | Fair $39,441 |
| Colombians | 36.9 /100 | #186 | Fair $39,439 |
| Swedes | 36.0 /100 | #187 | Fair $39,421 |
| Bermudans | 35.9 /100 | #188 | Fair $39,418 |
| Senegalese | 34.2 /100 | #189 | Fair $39,384 |
| Puget Sound Salish | 33.9 /100 | #190 | Fair $39,376 |
| Immigrants | Western Africa | 32.7 /100 | #191 | Fair $39,351 |
| Immigrants | Immigrants | 31.7 /100 | #192 | Fair $39,328 |
| Immigrants | Nigeria | 30.2 /100 | #193 | Fair $39,294 |
| Irish | 30.0 /100 | #194 | Fair $39,291 |
| Uruguayans | 27.3 /100 | #195 | Fair $39,228 |
| Immigrants | Costa Rica | 25.6 /100 | #196 | Fair $39,186 |
| Assyrians/Chaldeans/Syriacs | 24.6 /100 | #197 | Fair $39,159 |