Bahamian vs Immigrants from Southern Europe Median Family Income

COMPARE

Bahamian
Race
Ancestry
AfghanAfricanAlaska NativeAlaskan AthabascanAlbanianAleutAlsatianAmericanApacheArabArapahoArgentineanArmenianAssyrian/Chaldean/SyriacAustralianAustrianBahamianBangladeshiBarbadianBasqueBelgianBelizeanBermudanBhutaneseBlackfeetBolivianBrazilianBritishBritish West IndianBulgarianBurmeseCajunCambodianCanadianCape VerdeanCarpatho RusynCelticCentral AmericanCentral American IndianCherokeeCheyenneChickasawChileanChineseChippewaChoctawColombianColvilleComancheCosta RicanCreeCreekCroatianCrowCubanCypriotCzechCzechoslovakianDanishDelawareDominicanDutchDutch West IndianEastern EuropeanEcuadorianEgyptianEnglishEstonianEthiopianEuropeanFijianFilipinoFinnishFrenchFrench American IndianFrench CanadianGermanGerman RussianGhanaianGreekGuamanian/ChamorroGuatemalanGuyaneseHaitianHmongHonduranHopiHoumaHungarianIcelanderIndian (Asian)IndonesianInupiatIranianIraqiIrishIroquoisIsraeliItalianJamaicanJapaneseJordanianKenyanKiowaKoreanLaotianLatvianLebaneseLiberianLithuanianLumbeeLuxembourgerMacedonianMalaysianMalteseMarshalleseMenomineeMexicanMexican American IndianMongolianMoroccanNative HawaiianNavajoNepaleseNew ZealanderNicaraguanNigerianNorthern EuropeanNorwegianOkinawanOsageOttawaPaiutePakistaniPalestinianPanamanianParaguayanPennsylvania GermanPeruvianPimaPolishPortuguesePotawatomiPuebloPuerto RicanPuget Sound SalishRomanianRussianSalvadoranSamoanScandinavianScotch-IrishScottishSeminoleSenegaleseSerbianShoshoneSierra LeoneanSiouxSlavicSlovakSloveneSomaliSouth AfricanSouth AmericanSouth American IndianSoviet UnionSpaniardSpanishSpanish AmericanSpanish American IndianSri LankanSubsaharan AfricanSudaneseSwedishSwissSyrianTaiwaneseThaiTlingit-HaidaTohono O'OdhamTonganTrinidadian and TobagonianTsimshianTurkishU.S. Virgin IslanderUgandanUkrainianUruguayanUteVenezuelanVietnameseWelshWest IndianYakamaYaquiYugoslavianYumanYup'ikZimbabwean
Immigration
NonimmigrantsImmigrantsAfghanistanAfricaAlbaniaArgentinaArmeniaAsiaAustraliaAustriaBahamasBangladeshBarbadosBelarusBelgiumBelizeBoliviaBosnia and HerzegovinaBrazilBulgariaBurma/MyanmarCabo VerdeCambodiaCameroonCanadaCaribbeanCentral AmericaChileChinaColombiaCongoCosta RicaCroatiaCubaCzechoslovakiaDenmarkDominicaDominican RepublicEastern AfricaEastern AsiaEastern EuropeEcuadorEgyptEl SalvadorEnglandEritreaEthiopiaEuropeFijiFranceGermanyGhanaGreeceGrenadaGuatemalaGuyanaHaitiHondurasHong KongHungaryIndiaIndonesiaIranIraqIrelandIsraelItalyJamaicaJapanJordanKazakhstanKenyaKoreaKuwaitLaosLatin AmericaLatviaLebanonLiberiaLithuaniaMalaysiaMexicoMicronesiaMiddle AfricaMoldovaMoroccoNepalNetherlandsNicaraguaNigeriaNorth AmericaNorth MacedoniaNorthern AfricaNorthern EuropeNorwayOceaniaPakistanPanamaPeruPhilippinesPolandPortugalRomaniaRussiaSaudi ArabiaScotlandSenegalSerbiaSierra LeoneSingaporeSomaliaSouth AfricaSouth AmericaSouth Central AsiaSouth Eastern AsiaSpainSri LankaSt. Vincent and the GrenadinesSudanSwedenSwitzerlandSyriaTaiwanThailandTrinidad and TobagoTurkeyUgandaUkraineUruguayUzbekistanVenezuelaVietnamWest IndiesWestern AfricaWestern AsiaWestern EuropeYemenZaireZimbabweAzores
Immigrants from Southern Europe
Race
Ancestry
AfghanAfricanAlaska NativeAlaskan AthabascanAlbanianAleutAlsatianAmericanApacheArabArapahoArgentineanArmenianAssyrian/Chaldean/SyriacAustralianAustrianBangladeshiBarbadianBasqueBelgianBelizeanBermudanBhutaneseBlackfeetBolivianBrazilianBritishBritish West IndianBulgarianBurmeseCajunCambodianCanadianCape VerdeanCarpatho RusynCelticCentral AmericanCentral American IndianCherokeeCheyenneChickasawChileanChineseChippewaChoctawColombianColvilleComancheCosta RicanCreeCreekCroatianCrowCubanCypriotCzechCzechoslovakianDanishDelawareDominicanDutchDutch West IndianEastern EuropeanEcuadorianEgyptianEnglishEstonianEthiopianEuropeanFijianFilipinoFinnishFrenchFrench American IndianFrench CanadianGermanGerman RussianGhanaianGreekGuamanian/ChamorroGuatemalanGuyaneseHaitianHmongHonduranHopiHoumaHungarianIcelanderIndian (Asian)IndonesianInupiatIranianIraqiIrishIroquoisIsraeliItalianJamaicanJapaneseJordanianKenyanKiowaKoreanLaotianLatvianLebaneseLiberianLithuanianLumbeeLuxembourgerMacedonianMalaysianMalteseMarshalleseMenomineeMexicanMexican American IndianMongolianMoroccanNative HawaiianNavajoNepaleseNew ZealanderNicaraguanNigerianNorthern EuropeanNorwegianOkinawanOsageOttawaPaiutePakistaniPalestinianPanamanianParaguayanPennsylvania GermanPeruvianPimaPolishPortuguesePotawatomiPuebloPuerto RicanPuget Sound SalishRomanianRussianSalvadoranSamoanScandinavianScotch-IrishScottishSeminoleSenegaleseSerbianShoshoneSierra LeoneanSiouxSlavicSlovakSloveneSomaliSouth AfricanSouth AmericanSouth American IndianSoviet UnionSpaniardSpanishSpanish AmericanSpanish American IndianSri LankanSubsaharan AfricanSudaneseSwedishSwissSyrianTaiwaneseThaiTlingit-HaidaTohono O'OdhamTonganTrinidadian and TobagonianTsimshianTurkishU.S. Virgin IslanderUgandanUkrainianUruguayanUteVenezuelanVietnameseWelshWest IndianYakamaYaquiYugoslavianYumanYup'ikZimbabwean
Immigration
NonimmigrantsImmigrantsAfghanistanAfricaAlbaniaArgentinaArmeniaAsiaAustraliaAustriaBahamasBangladeshBarbadosBelarusBelgiumBelizeBoliviaBosnia and HerzegovinaBrazilBulgariaBurma/MyanmarCabo VerdeCambodiaCameroonCanadaCaribbeanCentral AmericaChileChinaColombiaCongoCosta RicaCroatiaCubaCzechoslovakiaDenmarkDominicaDominican RepublicEastern AfricaEastern AsiaEastern EuropeEcuadorEgyptEl SalvadorEnglandEritreaEthiopiaEuropeFijiFranceGermanyGhanaGreeceGrenadaGuatemalaGuyanaHaitiHondurasHong KongHungaryIndiaIndonesiaIranIraqIrelandIsraelItalyJamaicaJapanJordanKazakhstanKenyaKoreaKuwaitLaosLatin AmericaLatviaLebanonLiberiaLithuaniaMalaysiaMexicoMicronesiaMiddle AfricaMoldovaMoroccoNepalNetherlandsNicaraguaNigeriaNorth AmericaNorth MacedoniaNorthern AfricaNorthern EuropeNorwayOceaniaPakistanPanamaPeruPhilippinesPolandPortugalRomaniaRussiaSaudi ArabiaScotlandSenegalSerbiaSierra LeoneSingaporeSomaliaSouth AfricaSouth AmericaSouth Central AsiaSouth Eastern AsiaSouthern EuropeSpainSri LankaSt. Vincent and the GrenadinesSudanSwedenSwitzerlandSyriaTaiwanThailandTrinidad and TobagoTurkeyUgandaUkraineUruguayUzbekistanVenezuelaVietnamWest IndiesWestern AfricaWestern AsiaWestern EuropeYemenZaireZimbabweAzores
Median Family Income
Income
Poverty
Unemployment
Labor Participation
Family Structure
Vehicle Availability
Education Level
Disability

Median Family Income Comparison

Bahamians

Immigrants from Southern Europe

Tragic
Exceptional
$82,631
MEDIAN FAMILY INCOME
0.0/ 100
METRIC RATING
323rd/ 347
METRIC RANK
$110,614
MEDIAN FAMILY INCOME
98.3/ 100
METRIC RATING
91st/ 347
METRIC RANK

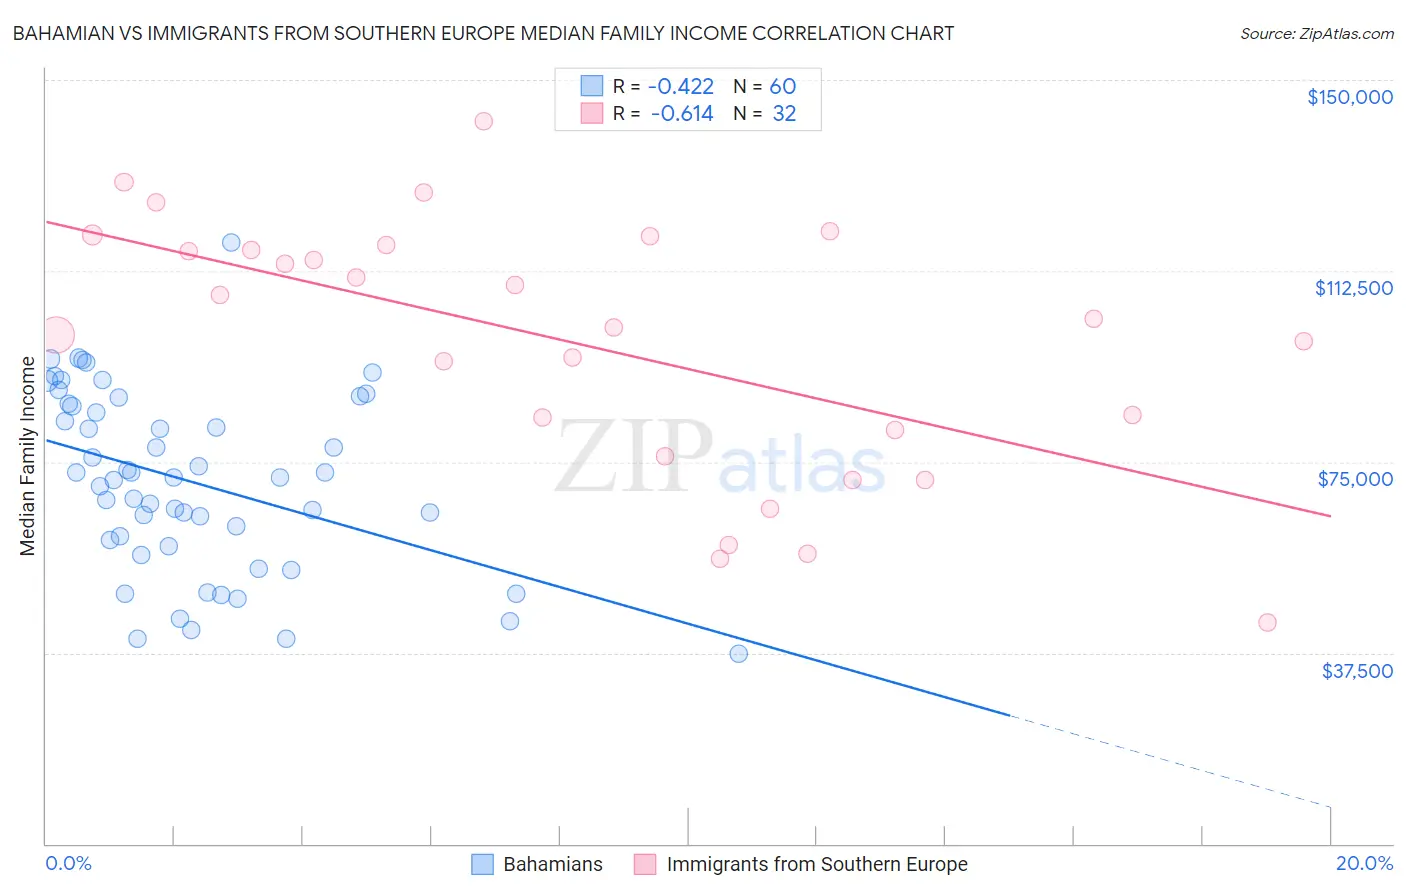
Bahamian vs Immigrants from Southern Europe Median Family Income Correlation Chart

The statistical analysis conducted on geographies consisting of 112,596,489 people shows a moderate negative correlation between the proportion of Bahamians and median family income in the United States with a correlation coefficient (R) of -0.422 and weighted average of $82,631. Similarly, the statistical analysis conducted on geographies consisting of 402,509,296 people shows a significant negative correlation between the proportion of Immigrants from Southern Europe and median family income in the United States with a correlation coefficient (R) of -0.614 and weighted average of $110,614, a difference of 33.9%.
Bahamian vs Immigrants from Southern Europe Median Family Income

Median Family Income Correlation Summary

MeasurementBahamianImmigrants from Southern Europe
Minimum$37,231$43,571
Maximum$118,067$141,836
Range$80,836$98,265
Mean$71,118$97,967
Median$71,812$102,217
Interquartile 25% (IQ1)$59,044$78,639
Interquartile 75% (IQ3)$86,176$117,023
Interquartile Range (IQR)$27,132$38,384
Standard Deviation (Sample)$17,647$25,189
Standard Deviation (Population)$17,499$24,793

Similar Demographics by Median Family Income

Demographics Similar to Bahamians by Median Family Income

In terms of median family income, the demographic groups most similar to Bahamians are Creek ($82,560, a difference of 0.090%), Sioux ($82,386, a difference of 0.30%), Dominican ($82,888, a difference of 0.31%), Immigrants from Congo ($82,216, a difference of 0.51%), and Arapaho ($82,064, a difference of 0.69%).
DemographicsRating | RankMedian Family Income
Immigrants | Haiti
0.0
/100
|
#316
Tragic
$84,018
Yakama
0.0
/100
|
#317
Tragic
$83,932
Immigrants | Mexico
0.0
/100
|
#318
Tragic
$83,639
Immigrants | Honduras
0.0
/100
|
#319
Tragic
$83,618
Seminole
0.0
/100
|
#320
Tragic
$83,354
Immigrants | Caribbean
0.0
/100
|
#321
Tragic
$83,319
Dominicans
0.0
/100
|
#322
Tragic
$82,888
Bahamians
0.0
/100
|
#323
Tragic
$82,631
Creek
0.0
/100
|
#324
Tragic
$82,560
Sioux
0.0
/100
|
#325
Tragic
$82,386
Immigrants | Congo
0.0
/100
|
#326
Tragic
$82,216
Arapaho
0.0
/100
|
#327
Tragic
$82,064
Blacks/African Americans
0.0
/100
|
#328
Tragic
$81,912
Dutch West Indians
0.0
/100
|
#329
Tragic
$81,852
Cheyenne
0.0
/100
|
#330
Tragic
$81,385

Demographics Similar to Immigrants from Southern Europe by Median Family Income

In terms of median family income, the demographic groups most similar to Immigrants from Southern Europe are Northern European ($110,635, a difference of 0.020%), Immigrants from Argentina ($110,873, a difference of 0.23%), Immigrants from Lebanon ($110,159, a difference of 0.41%), Immigrants from Kazakhstan ($110,137, a difference of 0.43%), and Korean ($110,103, a difference of 0.46%).
DemographicsRating | RankMedian Family Income
Immigrants | Hungary
98.8
/100
|
#84
Exceptional
$111,378
Croatians
98.8
/100
|
#85
Exceptional
$111,370
Ukrainians
98.8
/100
|
#86
Exceptional
$111,368
Austrians
98.8
/100
|
#87
Exceptional
$111,306
Romanians
98.8
/100
|
#88
Exceptional
$111,243
Immigrants | Argentina
98.5
/100
|
#89
Exceptional
$110,873
Northern Europeans
98.3
/100
|
#90
Exceptional
$110,635
Immigrants | Southern Europe
98.3
/100
|
#91
Exceptional
$110,614
Immigrants | Lebanon
97.9
/100
|
#92
Exceptional
$110,159
Immigrants | Kazakhstan
97.8
/100
|
#93
Exceptional
$110,137
Koreans
97.8
/100
|
#94
Exceptional
$110,103
Zimbabweans
97.7
/100
|
#95
Exceptional
$110,011
Immigrants | Moldova
97.7
/100
|
#96
Exceptional
$109,975
Jordanians
97.5
/100
|
#97
Exceptional
$109,865
Immigrants | Kuwait
97.4
/100
|
#98
Exceptional
$109,731