Bahamian vs Immigrants from Southern Europe Male Unemployment

COMPARE

Bahamian
Race
Ancestry
AfghanAfricanAlaska NativeAlaskan AthabascanAlbanianAleutAlsatianAmericanApacheArabArapahoArgentineanArmenianAssyrian/Chaldean/SyriacAustralianAustrianBahamianBangladeshiBarbadianBasqueBelgianBelizeanBermudanBhutaneseBlackfeetBolivianBrazilianBritishBritish West IndianBulgarianBurmeseCajunCambodianCanadianCape VerdeanCarpatho RusynCelticCentral AmericanCentral American IndianCherokeeCheyenneChickasawChileanChineseChippewaChoctawColombianColvilleComancheCosta RicanCreeCreekCroatianCrowCubanCypriotCzechCzechoslovakianDanishDelawareDominicanDutchDutch West IndianEastern EuropeanEcuadorianEgyptianEnglishEstonianEthiopianEuropeanFijianFilipinoFinnishFrenchFrench American IndianFrench CanadianGermanGerman RussianGhanaianGreekGuamanian/ChamorroGuatemalanGuyaneseHaitianHmongHonduranHopiHoumaHungarianIcelanderIndian (Asian)IndonesianInupiatIranianIraqiIrishIroquoisIsraeliItalianJamaicanJapaneseJordanianKenyanKiowaKoreanLaotianLatvianLebaneseLiberianLithuanianLumbeeLuxembourgerMacedonianMalaysianMalteseMarshalleseMenomineeMexicanMexican American IndianMongolianMoroccanNative HawaiianNavajoNepaleseNew ZealanderNicaraguanNigerianNorthern EuropeanNorwegianOkinawanOsageOttawaPaiutePakistaniPalestinianPanamanianParaguayanPennsylvania GermanPeruvianPimaPolishPortuguesePotawatomiPuebloPuerto RicanPuget Sound SalishRomanianRussianSalvadoranSamoanScandinavianScotch-IrishScottishSeminoleSenegaleseSerbianShoshoneSierra LeoneanSiouxSlavicSlovakSloveneSomaliSouth AfricanSouth AmericanSouth American IndianSoviet UnionSpaniardSpanishSpanish AmericanSpanish American IndianSri LankanSubsaharan AfricanSudaneseSwedishSwissSyrianTaiwaneseThaiTlingit-HaidaTohono O'OdhamTonganTrinidadian and TobagonianTsimshianTurkishU.S. Virgin IslanderUgandanUkrainianUruguayanUteVenezuelanVietnameseWelshWest IndianYakamaYaquiYugoslavianYumanYup'ikZimbabwean
Immigration
NonimmigrantsImmigrantsAfghanistanAfricaAlbaniaArgentinaArmeniaAsiaAustraliaAustriaBahamasBangladeshBarbadosBelarusBelgiumBelizeBoliviaBosnia and HerzegovinaBrazilBulgariaBurma/MyanmarCabo VerdeCambodiaCameroonCanadaCaribbeanCentral AmericaChileChinaColombiaCongoCosta RicaCroatiaCubaCzechoslovakiaDenmarkDominicaDominican RepublicEastern AfricaEastern AsiaEastern EuropeEcuadorEgyptEl SalvadorEnglandEritreaEthiopiaEuropeFijiFranceGermanyGhanaGreeceGrenadaGuatemalaGuyanaHaitiHondurasHong KongHungaryIndiaIndonesiaIranIraqIrelandIsraelItalyJamaicaJapanJordanKazakhstanKenyaKoreaKuwaitLaosLatin AmericaLatviaLebanonLiberiaLithuaniaMalaysiaMexicoMicronesiaMiddle AfricaMoldovaMoroccoNepalNetherlandsNicaraguaNigeriaNorth AmericaNorth MacedoniaNorthern AfricaNorthern EuropeNorwayOceaniaPakistanPanamaPeruPhilippinesPolandPortugalRomaniaRussiaSaudi ArabiaScotlandSenegalSerbiaSierra LeoneSingaporeSomaliaSouth AfricaSouth AmericaSouth Central AsiaSouth Eastern AsiaSpainSri LankaSt. Vincent and the GrenadinesSudanSwedenSwitzerlandSyriaTaiwanThailandTrinidad and TobagoTurkeyUgandaUkraineUruguayUzbekistanVenezuelaVietnamWest IndiesWestern AfricaWestern AsiaWestern EuropeYemenZaireZimbabweAzores
Immigrants from Southern Europe
Race
Ancestry
AfghanAfricanAlaska NativeAlaskan AthabascanAlbanianAleutAlsatianAmericanApacheArabArapahoArgentineanArmenianAssyrian/Chaldean/SyriacAustralianAustrianBangladeshiBarbadianBasqueBelgianBelizeanBermudanBhutaneseBlackfeetBolivianBrazilianBritishBritish West IndianBulgarianBurmeseCajunCambodianCanadianCape VerdeanCarpatho RusynCelticCentral AmericanCentral American IndianCherokeeCheyenneChickasawChileanChineseChippewaChoctawColombianColvilleComancheCosta RicanCreeCreekCroatianCrowCubanCypriotCzechCzechoslovakianDanishDelawareDominicanDutchDutch West IndianEastern EuropeanEcuadorianEgyptianEnglishEstonianEthiopianEuropeanFijianFilipinoFinnishFrenchFrench American IndianFrench CanadianGermanGerman RussianGhanaianGreekGuamanian/ChamorroGuatemalanGuyaneseHaitianHmongHonduranHopiHoumaHungarianIcelanderIndian (Asian)IndonesianInupiatIranianIraqiIrishIroquoisIsraeliItalianJamaicanJapaneseJordanianKenyanKiowaKoreanLaotianLatvianLebaneseLiberianLithuanianLumbeeLuxembourgerMacedonianMalaysianMalteseMarshalleseMenomineeMexicanMexican American IndianMongolianMoroccanNative HawaiianNavajoNepaleseNew ZealanderNicaraguanNigerianNorthern EuropeanNorwegianOkinawanOsageOttawaPaiutePakistaniPalestinianPanamanianParaguayanPennsylvania GermanPeruvianPimaPolishPortuguesePotawatomiPuebloPuerto RicanPuget Sound SalishRomanianRussianSalvadoranSamoanScandinavianScotch-IrishScottishSeminoleSenegaleseSerbianShoshoneSierra LeoneanSiouxSlavicSlovakSloveneSomaliSouth AfricanSouth AmericanSouth American IndianSoviet UnionSpaniardSpanishSpanish AmericanSpanish American IndianSri LankanSubsaharan AfricanSudaneseSwedishSwissSyrianTaiwaneseThaiTlingit-HaidaTohono O'OdhamTonganTrinidadian and TobagonianTsimshianTurkishU.S. Virgin IslanderUgandanUkrainianUruguayanUteVenezuelanVietnameseWelshWest IndianYakamaYaquiYugoslavianYumanYup'ikZimbabwean
Immigration
NonimmigrantsImmigrantsAfghanistanAfricaAlbaniaArgentinaArmeniaAsiaAustraliaAustriaBahamasBangladeshBarbadosBelarusBelgiumBelizeBoliviaBosnia and HerzegovinaBrazilBulgariaBurma/MyanmarCabo VerdeCambodiaCameroonCanadaCaribbeanCentral AmericaChileChinaColombiaCongoCosta RicaCroatiaCubaCzechoslovakiaDenmarkDominicaDominican RepublicEastern AfricaEastern AsiaEastern EuropeEcuadorEgyptEl SalvadorEnglandEritreaEthiopiaEuropeFijiFranceGermanyGhanaGreeceGrenadaGuatemalaGuyanaHaitiHondurasHong KongHungaryIndiaIndonesiaIranIraqIrelandIsraelItalyJamaicaJapanJordanKazakhstanKenyaKoreaKuwaitLaosLatin AmericaLatviaLebanonLiberiaLithuaniaMalaysiaMexicoMicronesiaMiddle AfricaMoldovaMoroccoNepalNetherlandsNicaraguaNigeriaNorth AmericaNorth MacedoniaNorthern AfricaNorthern EuropeNorwayOceaniaPakistanPanamaPeruPhilippinesPolandPortugalRomaniaRussiaSaudi ArabiaScotlandSenegalSerbiaSierra LeoneSingaporeSomaliaSouth AfricaSouth AmericaSouth Central AsiaSouth Eastern AsiaSouthern EuropeSpainSri LankaSt. Vincent and the GrenadinesSudanSwedenSwitzerlandSyriaTaiwanThailandTrinidad and TobagoTurkeyUgandaUkraineUruguayUzbekistanVenezuelaVietnamWest IndiesWestern AfricaWestern AsiaWestern EuropeYemenZaireZimbabweAzores
Male Unemployment
Income
Poverty
Unemployment
Labor Participation
Family Structure
Vehicle Availability
Education Level
Disability

Male Unemployment Comparison

Bahamians

Immigrants from Southern Europe

Tragic
Poor
5.9%
MALE UNEMPLOYMENT
0.0/ 100
METRIC RATING
266th/ 347
METRIC RANK
5.4%
MALE UNEMPLOYMENT
17.7/ 100
METRIC RATING
195th/ 347
METRIC RANK

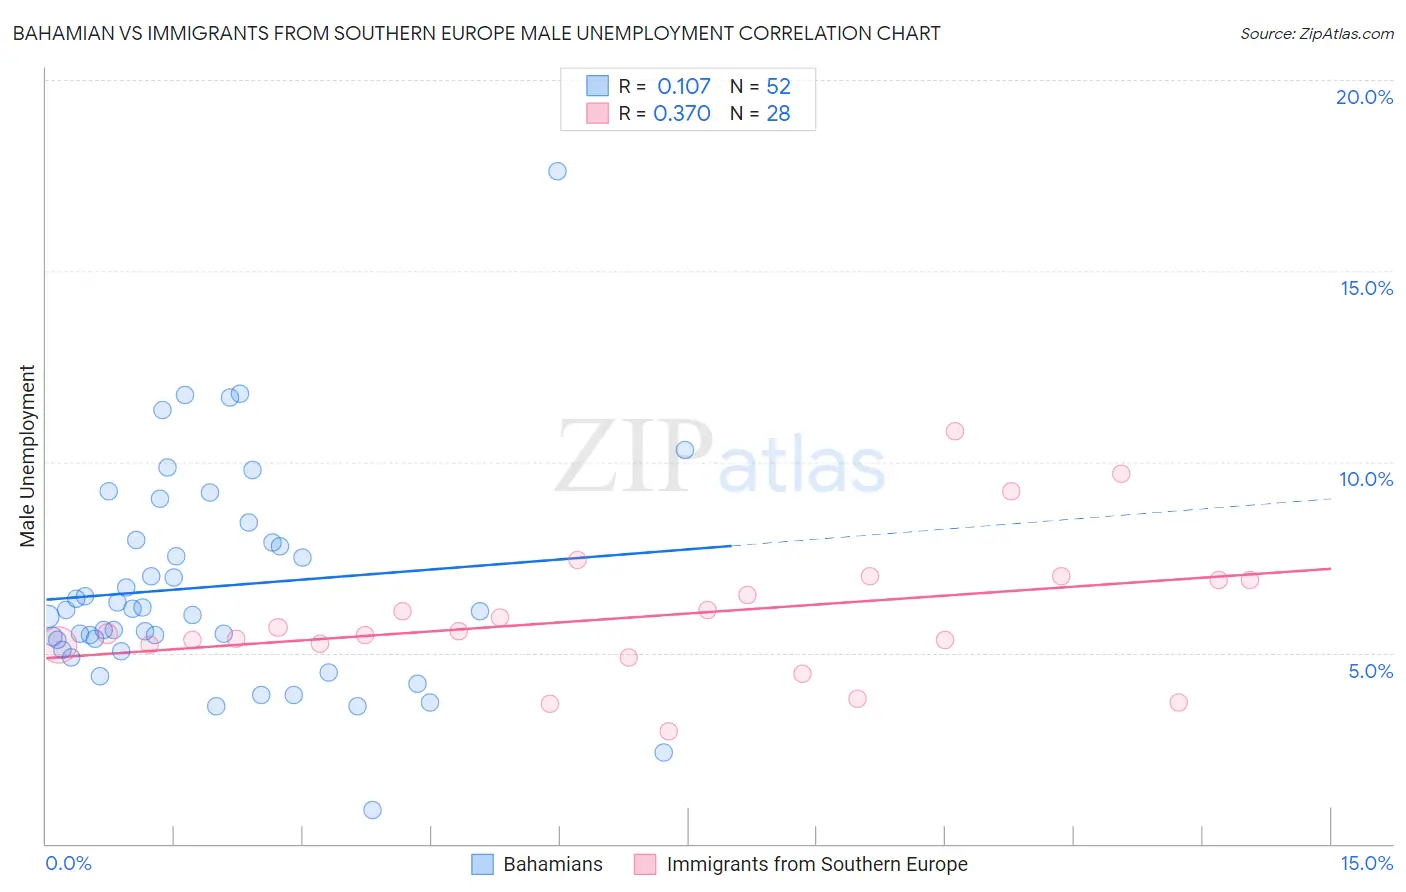
Bahamian vs Immigrants from Southern Europe Male Unemployment Correlation Chart

The statistical analysis conducted on geographies consisting of 112,565,011 people shows a poor positive correlation between the proportion of Bahamians and unemployment rate among males in the United States with a correlation coefficient (R) of 0.107 and weighted average of 5.9%. Similarly, the statistical analysis conducted on geographies consisting of 401,185,353 people shows a mild positive correlation between the proportion of Immigrants from Southern Europe and unemployment rate among males in the United States with a correlation coefficient (R) of 0.370 and weighted average of 5.4%, a difference of 9.3%.
Bahamian vs Immigrants from Southern Europe Male Unemployment

Male Unemployment Correlation Summary

MeasurementBahamianImmigrants from Southern Europe
Minimum0.90%2.9%
Maximum17.6%10.8%
Range16.7%7.9%
Mean6.7%6.0%
Median6.1%5.5%
Interquartile 25% (IQ1)5.2%5.2%
Interquartile 75% (IQ3)7.9%6.9%
Interquartile Range (IQR)2.7%1.7%
Standard Deviation (Sample)2.9%1.8%
Standard Deviation (Population)2.8%1.7%

Similar Demographics by Male Unemployment

Demographics Similar to Bahamians by Male Unemployment

In terms of male unemployment, the demographic groups most similar to Bahamians are Nigerian (5.9%, a difference of 0.12%), French American Indian (5.9%, a difference of 0.14%), Bermudan (5.9%, a difference of 0.33%), Immigrants from Mexico (5.9%, a difference of 0.52%), and Immigrants from Nigeria (6.0%, a difference of 0.60%).
DemographicsRating | RankMale Unemployment
Cajuns
0.1
/100
|
#259
Tragic
5.8%
Immigrants | Central America
0.1
/100
|
#260
Tragic
5.8%
Liberians
0.1
/100
|
#261
Tragic
5.8%
Immigrants | Portugal
0.1
/100
|
#262
Tragic
5.9%
Immigrants | Latin America
0.1
/100
|
#263
Tragic
5.9%
Immigrants | Mexico
0.0
/100
|
#264
Tragic
5.9%
French American Indians
0.0
/100
|
#265
Tragic
5.9%
Bahamians
0.0
/100
|
#266
Tragic
5.9%
Nigerians
0.0
/100
|
#267
Tragic
5.9%
Bermudans
0.0
/100
|
#268
Tragic
5.9%
Immigrants | Nigeria
0.0
/100
|
#269
Tragic
6.0%
Sub-Saharan Africans
0.0
/100
|
#270
Tragic
6.0%
Blackfeet
0.0
/100
|
#271
Tragic
6.0%
Immigrants | Uzbekistan
0.0
/100
|
#272
Tragic
6.0%
Armenians
0.0
/100
|
#273
Tragic
6.0%

Demographics Similar to Immigrants from Southern Europe by Male Unemployment

In terms of male unemployment, the demographic groups most similar to Immigrants from Southern Europe are Albanian (5.4%, a difference of 0.040%), Alsatian (5.4%, a difference of 0.10%), Spanish (5.4%, a difference of 0.18%), Immigrants from Thailand (5.4%, a difference of 0.32%), and Immigrants from Greece (5.4%, a difference of 0.34%).
DemographicsRating | RankMale Unemployment
Arabs
30.2
/100
|
#188
Fair
5.4%
Immigrants | South America
29.4
/100
|
#189
Fair
5.4%
Immigrants | Uganda
28.8
/100
|
#190
Fair
5.4%
Immigrants | South Eastern Asia
28.2
/100
|
#191
Fair
5.4%
Immigrants | Belarus
26.0
/100
|
#192
Fair
5.4%
Immigrants | Israel
25.2
/100
|
#193
Fair
5.4%
Spanish
19.7
/100
|
#194
Poor
5.4%
Immigrants | Southern Europe
17.7
/100
|
#195
Poor
5.4%
Albanians
17.3
/100
|
#196
Poor
5.4%
Alsatians
16.7
/100
|
#197
Poor
5.4%
Immigrants | Thailand
14.7
/100
|
#198
Poor
5.4%
Immigrants | Greece
14.5
/100
|
#199
Poor
5.4%
Immigrants | Zaire
13.7
/100
|
#200
Poor
5.4%
Immigrants | Philippines
13.5
/100
|
#201
Poor
5.4%
Immigrants | Nonimmigrants
13.1
/100
|
#202
Poor
5.4%