Arapaho vs Italian Per Capita Income
COMPARE
Arapaho
Italian
Per Capita Income
Per Capita Income Comparison
Arapaho
Italians
$32,345
PER CAPITA INCOME
0.0/ 100
METRIC RATING
338th/ 347
METRIC RANK
$47,574
PER CAPITA INCOME
98.8/ 100
METRIC RATING
90th/ 347
METRIC RANK
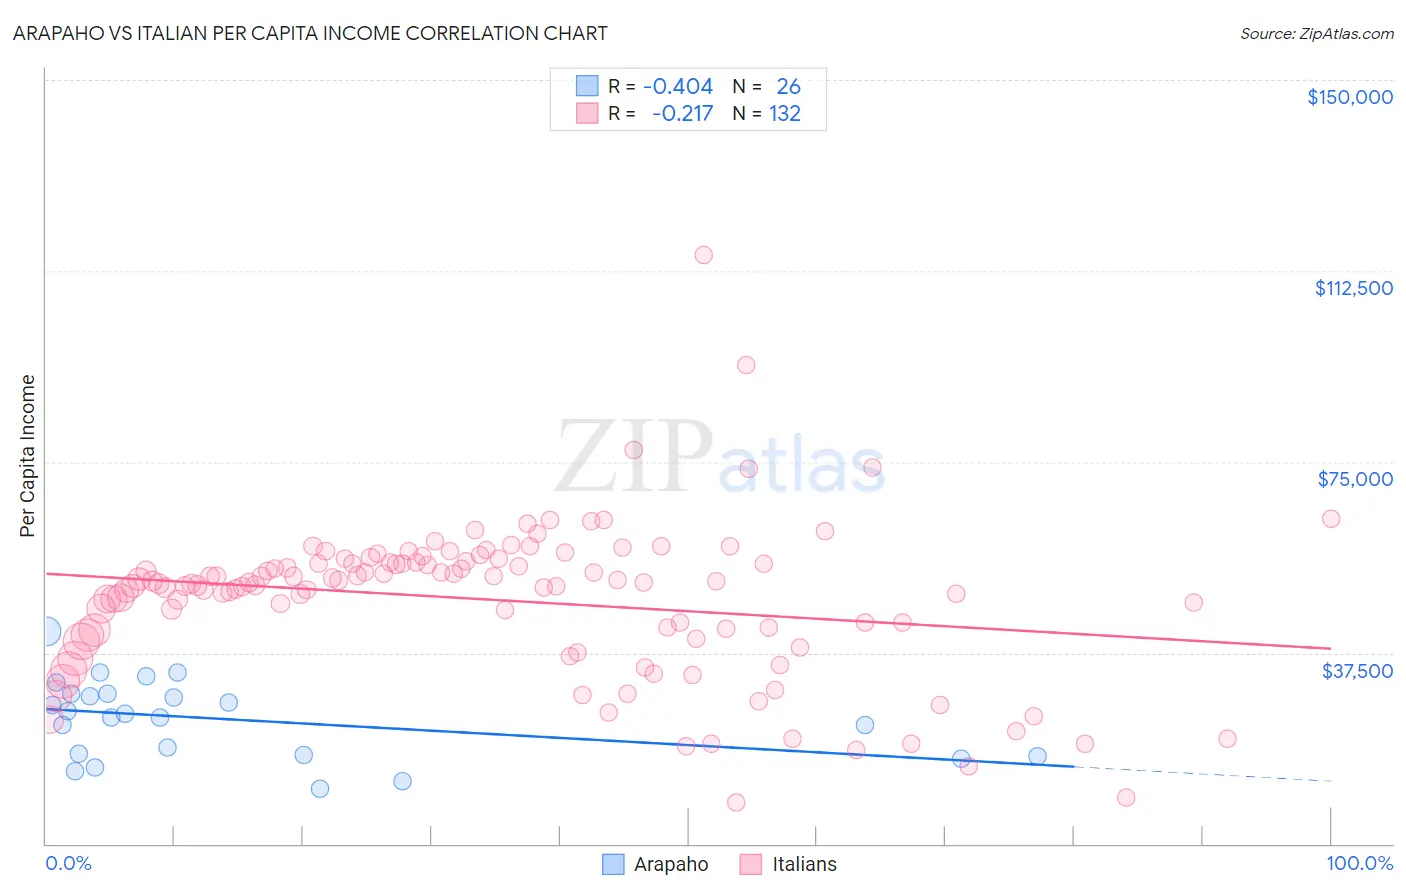
Arapaho vs Italian Per Capita Income Correlation Chart
The statistical analysis conducted on geographies consisting of 29,780,267 people shows a moderate negative correlation between the proportion of Arapaho and per capita income in the United States with a correlation coefficient (R) of -0.404 and weighted average of $32,345. Similarly, the statistical analysis conducted on geographies consisting of 575,176,397 people shows a weak negative correlation between the proportion of Italians and per capita income in the United States with a correlation coefficient (R) of -0.217 and weighted average of $47,574, a difference of 47.1%.
Per Capita Income Correlation Summary
| Measurement | Arapaho | Italian |
| Minimum | $10,798 | $7,984 |
| Maximum | $41,687 | $115,662 |
| Range | $30,889 | $107,678 |
| Mean | $24,378 | $47,928 |
| Median | $25,279 | $51,120 |
| Interquartile 25% (IQ1) | $17,440 | $41,399 |
| Interquartile 75% (IQ3) | $29,495 | $55,329 |
| Interquartile Range (IQR) | $12,055 | $13,930 |
| Standard Deviation (Sample) | $7,667 | $15,071 |
| Standard Deviation (Population) | $7,518 | $15,014 |
Similar Demographics by Per Capita Income
Demographics Similar to Arapaho by Per Capita Income
In terms of per capita income, the demographic groups most similar to Arapaho are Pueblo ($32,012, a difference of 1.0%), Crow ($31,729, a difference of 1.9%), Houma ($32,996, a difference of 2.0%), Yakama ($33,009, a difference of 2.1%), and Yuman ($33,236, a difference of 2.8%).
| Demographics | Rating | Rank | Per Capita Income |
| Immigrants | Mexico | 0.0 /100 | #331 | Tragic $33,931 |
| Sioux | 0.0 /100 | #332 | Tragic $33,921 |
| Immigrants | Yemen | 0.0 /100 | #333 | Tragic $33,696 |
| Natives/Alaskans | 0.0 /100 | #334 | Tragic $33,279 |
| Yuman | 0.0 /100 | #335 | Tragic $33,236 |
| Yakama | 0.0 /100 | #336 | Tragic $33,009 |
| Houma | 0.0 /100 | #337 | Tragic $32,996 |
| Arapaho | 0.0 /100 | #338 | Tragic $32,345 |
| Pueblo | 0.0 /100 | #339 | Tragic $32,012 |
| Crow | 0.0 /100 | #340 | Tragic $31,729 |
| Puerto Ricans | 0.0 /100 | #341 | Tragic $31,268 |
| Hopi | 0.0 /100 | #342 | Tragic $31,177 |
| Pima | 0.0 /100 | #343 | Tragic $30,644 |
| Yup'ik | 0.0 /100 | #344 | Tragic $30,518 |
| Tohono O'odham | 0.0 /100 | #345 | Tragic $30,256 |
Demographics Similar to Italians by Per Capita Income
In terms of per capita income, the demographic groups most similar to Italians are Macedonian ($47,573, a difference of 0.0%), Immigrants from Moldova ($47,489, a difference of 0.18%), Northern European ($47,698, a difference of 0.26%), Croatian ($47,742, a difference of 0.35%), and Immigrants from Zimbabwe ($47,394, a difference of 0.38%).
| Demographics | Rating | Rank | Per Capita Income |
| Immigrants | Brazil | 99.4 /100 | #83 | Exceptional $48,164 |
| Immigrants | Ukraine | 99.3 /100 | #84 | Exceptional $48,134 |
| Austrians | 99.3 /100 | #85 | Exceptional $48,116 |
| Immigrants | Southern Europe | 99.3 /100 | #86 | Exceptional $48,027 |
| Ukrainians | 99.3 /100 | #87 | Exceptional $48,014 |
| Croatians | 99.0 /100 | #88 | Exceptional $47,742 |
| Northern Europeans | 98.9 /100 | #89 | Exceptional $47,698 |
| Italians | 98.8 /100 | #90 | Exceptional $47,574 |
| Macedonians | 98.8 /100 | #91 | Exceptional $47,573 |
| Immigrants | Moldova | 98.7 /100 | #92 | Exceptional $47,489 |
| Immigrants | Zimbabwe | 98.5 /100 | #93 | Exceptional $47,394 |
| Albanians | 98.5 /100 | #94 | Exceptional $47,379 |
| Immigrants | Egypt | 98.5 /100 | #95 | Exceptional $47,361 |
| Alsatians | 98.3 /100 | #96 | Exceptional $47,284 |
| Carpatho Rusyns | 98.2 /100 | #97 | Exceptional $47,248 |