Serbian vs Italian Per Capita Income
COMPARE
Serbian
Italian
Per Capita Income
Per Capita Income Comparison
Serbians
Italians
$46,551
PER CAPITA INCOME
96.2/ 100
METRIC RATING
107th/ 347
METRIC RANK
$47,574
PER CAPITA INCOME
98.8/ 100
METRIC RATING
90th/ 347
METRIC RANK
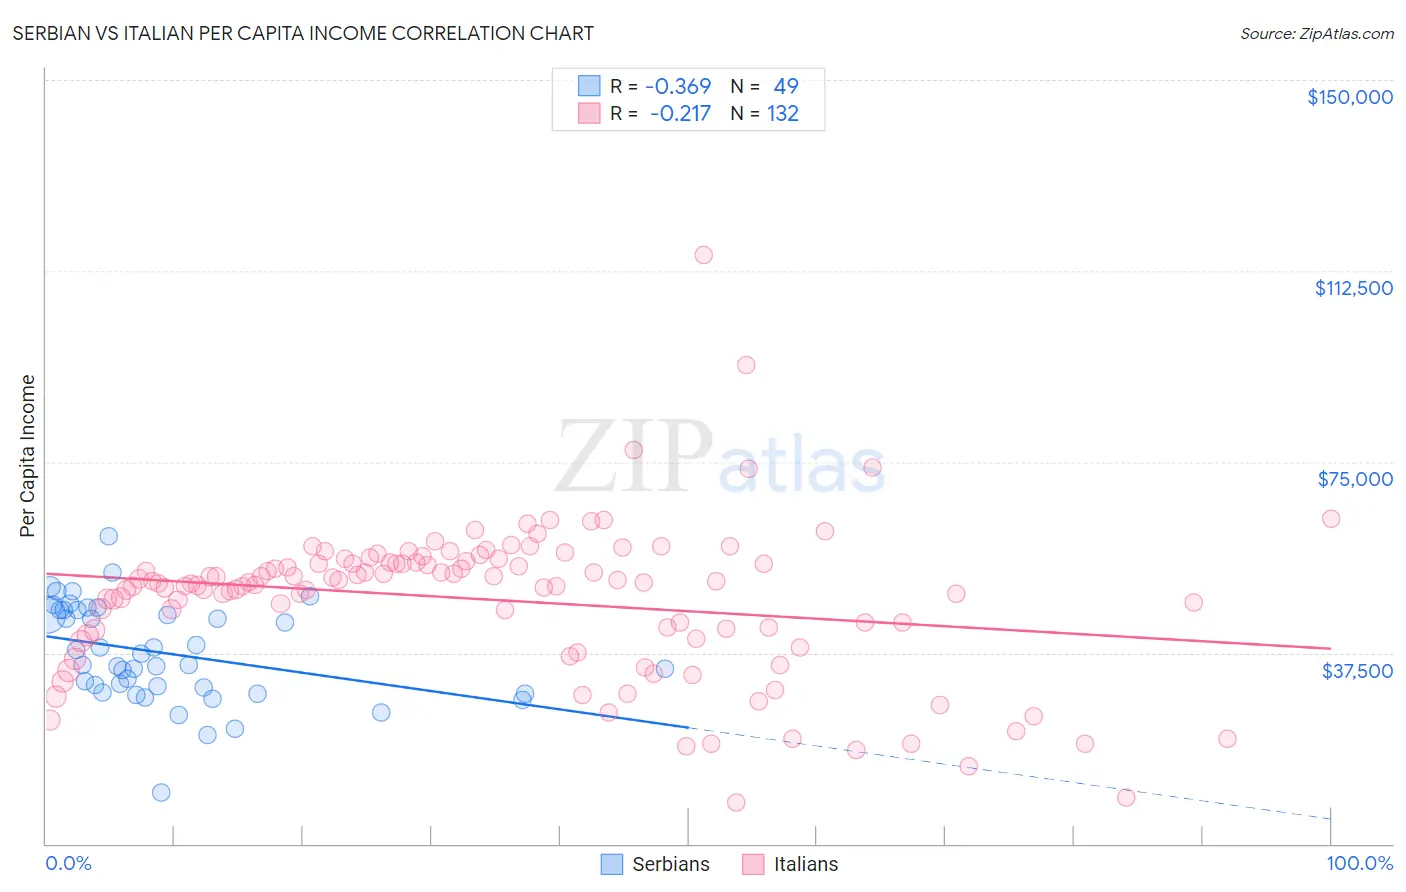
Serbian vs Italian Per Capita Income Correlation Chart
The statistical analysis conducted on geographies consisting of 267,655,306 people shows a mild negative correlation between the proportion of Serbians and per capita income in the United States with a correlation coefficient (R) of -0.369 and weighted average of $46,551. Similarly, the statistical analysis conducted on geographies consisting of 575,176,397 people shows a weak negative correlation between the proportion of Italians and per capita income in the United States with a correlation coefficient (R) of -0.217 and weighted average of $47,574, a difference of 2.2%.
Per Capita Income Correlation Summary
| Measurement | Serbian | Italian |
| Minimum | $10,108 | $7,984 |
| Maximum | $60,445 | $115,662 |
| Range | $50,337 | $107,678 |
| Mean | $37,423 | $47,928 |
| Median | $35,016 | $51,120 |
| Interquartile 25% (IQ1) | $30,161 | $41,399 |
| Interquartile 75% (IQ3) | $45,911 | $55,329 |
| Interquartile Range (IQR) | $15,749 | $13,930 |
| Standard Deviation (Sample) | $9,694 | $15,071 |
| Standard Deviation (Population) | $9,595 | $15,014 |
Demographics Similar to Serbians and Italians by Per Capita Income
In terms of per capita income, the demographic groups most similar to Serbians are Immigrants from Kuwait ($46,543, a difference of 0.020%), British ($46,571, a difference of 0.040%), Ethiopian ($46,569, a difference of 0.040%), Brazilian ($46,700, a difference of 0.32%), and Syrian ($46,837, a difference of 0.61%). Similarly, the demographic groups most similar to Italians are Macedonian ($47,573, a difference of 0.0%), Immigrants from Moldova ($47,489, a difference of 0.18%), Northern European ($47,698, a difference of 0.26%), Croatian ($47,742, a difference of 0.35%), and Immigrants from Zimbabwe ($47,394, a difference of 0.38%).
| Demographics | Rating | Rank | Per Capita Income |
| Croatians | 99.0 /100 | #88 | Exceptional $47,742 |
| Northern Europeans | 98.9 /100 | #89 | Exceptional $47,698 |
| Italians | 98.8 /100 | #90 | Exceptional $47,574 |
| Macedonians | 98.8 /100 | #91 | Exceptional $47,573 |
| Immigrants | Moldova | 98.7 /100 | #92 | Exceptional $47,489 |
| Immigrants | Zimbabwe | 98.5 /100 | #93 | Exceptional $47,394 |
| Albanians | 98.5 /100 | #94 | Exceptional $47,379 |
| Immigrants | Egypt | 98.5 /100 | #95 | Exceptional $47,361 |
| Alsatians | 98.3 /100 | #96 | Exceptional $47,284 |
| Carpatho Rusyns | 98.2 /100 | #97 | Exceptional $47,248 |
| Immigrants | Pakistan | 97.9 /100 | #98 | Exceptional $47,084 |
| Laotians | 97.8 /100 | #99 | Exceptional $47,041 |
| Immigrants | Lebanon | 97.5 /100 | #100 | Exceptional $46,938 |
| Immigrants | Uzbekistan | 97.5 /100 | #101 | Exceptional $46,929 |
| Immigrants | Western Asia | 97.4 /100 | #102 | Exceptional $46,876 |
| Syrians | 97.2 /100 | #103 | Exceptional $46,837 |
| Brazilians | 96.8 /100 | #104 | Exceptional $46,700 |
| British | 96.3 /100 | #105 | Exceptional $46,571 |
| Ethiopians | 96.3 /100 | #106 | Exceptional $46,569 |
| Serbians | 96.2 /100 | #107 | Exceptional $46,551 |
| Immigrants | Kuwait | 96.2 /100 | #108 | Exceptional $46,543 |