Zip Codes with the Highest Percentage of Population Employed in Arts, Entertainment & Recreation in Marion, IN
RELATED REPORTS & OPTIONS
Arts, Entertainment & Recreation
Marion
Compare Zip Codes
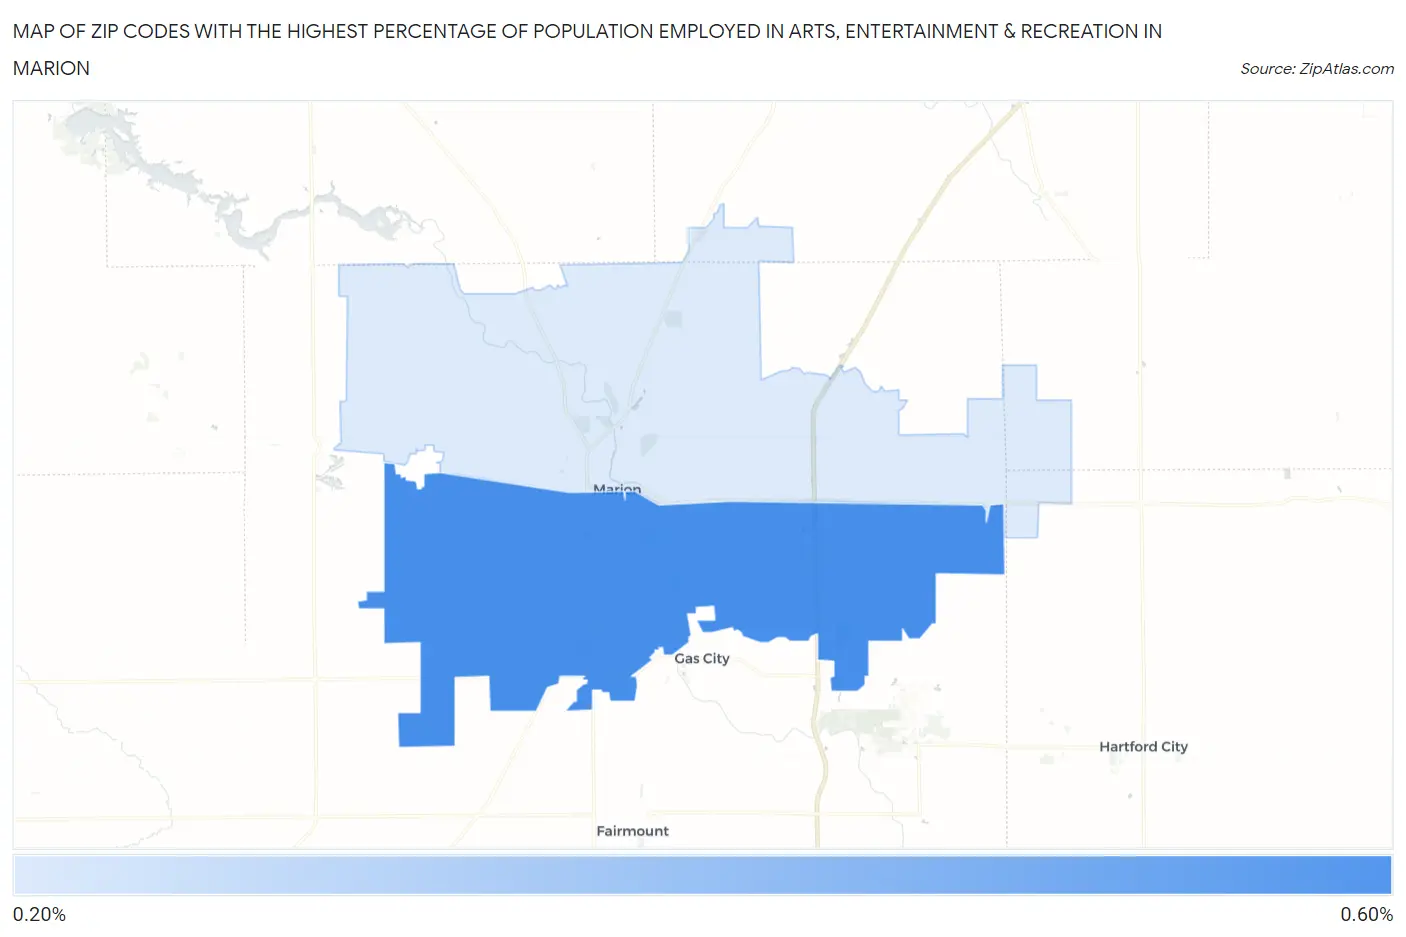
Map of Zip Codes with the Highest Percentage of Population Employed in Arts, Entertainment & Recreation in Marion
0.0%
0.60%
Zip Codes with the Highest Percentage of Population Employed in Arts, Entertainment & Recreation in Marion, IN
| Zip Code | % Employed | vs State | vs National | |
| 1. | 46953 | 0.55% | 1.6%(-1.09)#416 | 2.1%(-1.54)#20,199 |
| 2. | 46952 | 0.22% | 1.6%(-1.42)#473 | 2.1%(-1.86)#22,101 |
1
Common Questions
What are the Top Zip Codes with the Highest Percentage of Population Employed in Arts, Entertainment & Recreation in Marion, IN?
Top Zip Codes with the Highest Percentage of Population Employed in Arts, Entertainment & Recreation in Marion, IN are:
What zip code has the Highest Percentage of Population Employed in Arts, Entertainment & Recreation in Marion, IN?
46953 has the Highest Percentage of Population Employed in Arts, Entertainment & Recreation in Marion, IN with 0.55%.
What is the Percentage of Population Employed in Arts, Entertainment & Recreation in Marion, IN?
Percentage of Population Employed in Arts, Entertainment & Recreation in Marion is 8.7%.
What is the Percentage of Population Employed in Arts, Entertainment & Recreation in Indiana?
Percentage of Population Employed in Arts, Entertainment & Recreation in Indiana is 1.6%.
What is the Percentage of Population Employed in Arts, Entertainment & Recreation in the United States?
Percentage of Population Employed in Arts, Entertainment & Recreation in the United States is 2.1%.