Zip Codes with the Highest Percentage of Population Employed in Architecture & Engineering in Dubuque, IA
RELATED REPORTS & OPTIONS
Architecture & Engineering
Dubuque
Compare Zip Codes
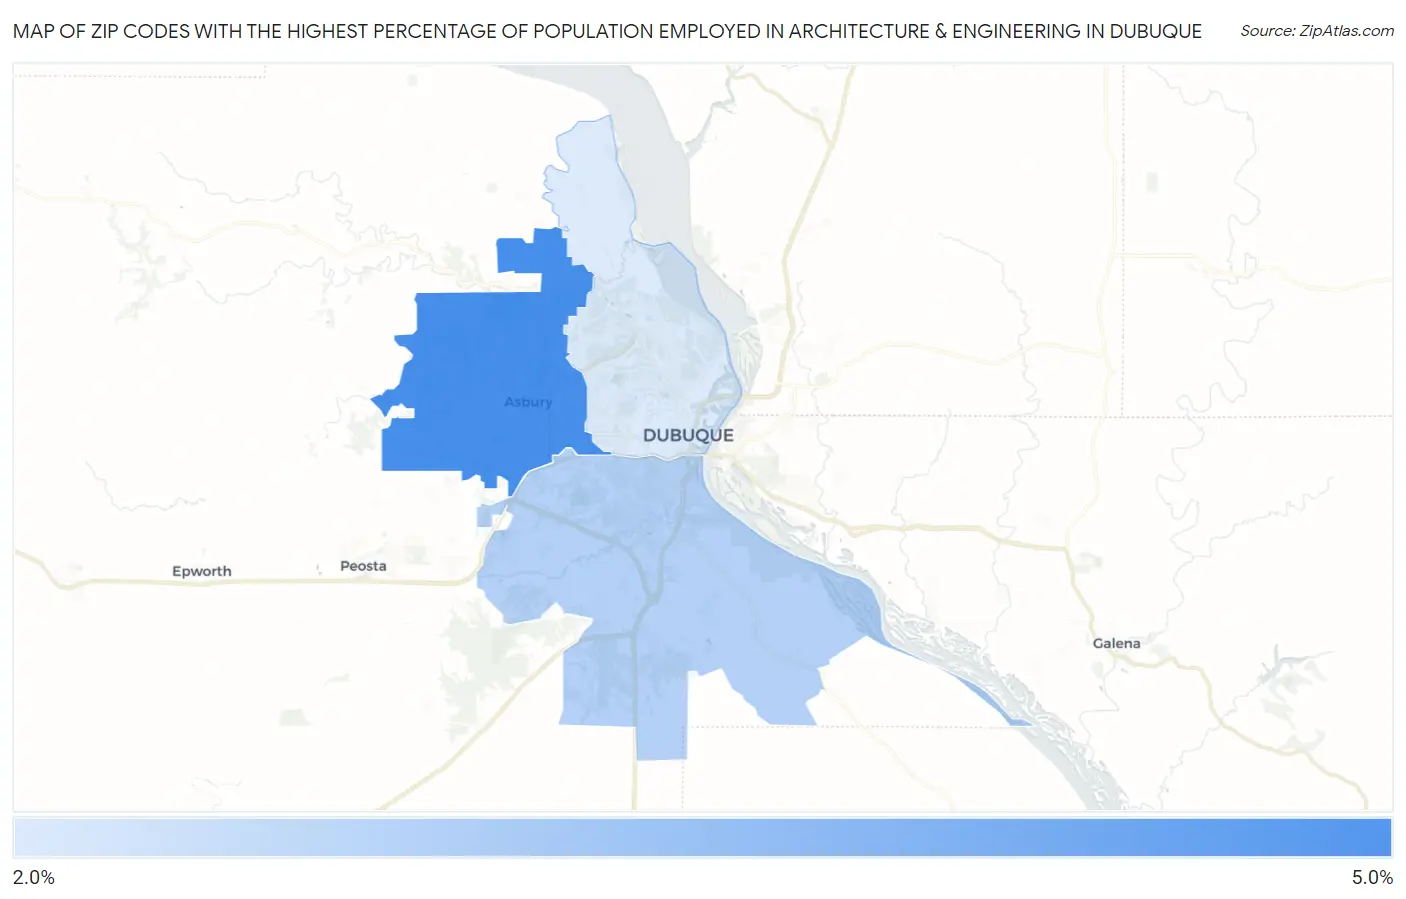
Map of Zip Codes with the Highest Percentage of Population Employed in Architecture & Engineering in Dubuque
0.0%
5.0%
Zip Codes with the Highest Percentage of Population Employed in Architecture & Engineering in Dubuque, IA
| Zip Code | % Employed | vs State | vs National | |
| 1. | 52002 | 4.5% | 1.8%(+2.69)#54 | 2.1%(+2.33)#2,158 |
| 2. | 52003 | 3.0% | 1.8%(+1.23)#124 | 2.1%(+0.869)#4,994 |
| 3. | 52001 | 2.5% | 1.8%(+0.670)#175 | 2.1%(+0.304)#7,209 |
1
Common Questions
What are the Top Zip Codes with the Highest Percentage of Population Employed in Architecture & Engineering in Dubuque, IA?
Top Zip Codes with the Highest Percentage of Population Employed in Architecture & Engineering in Dubuque, IA are:
What zip code has the Highest Percentage of Population Employed in Architecture & Engineering in Dubuque, IA?
52002 has the Highest Percentage of Population Employed in Architecture & Engineering in Dubuque, IA with 4.5%.
What is the Percentage of Population Employed in Architecture & Engineering in Dubuque, IA?
Percentage of Population Employed in Architecture & Engineering in Dubuque is 2.3%.
What is the Percentage of Population Employed in Architecture & Engineering in Iowa?
Percentage of Population Employed in Architecture & Engineering in Iowa is 1.8%.
What is the Percentage of Population Employed in Architecture & Engineering in the United States?
Percentage of Population Employed in Architecture & Engineering in the United States is 2.1%.