Zip Codes with the Highest Percentage of Population Employed in Legal Services & Support in Lithonia, GA
RELATED REPORTS & OPTIONS
Legal Services & Support
Lithonia
Compare Zip Codes
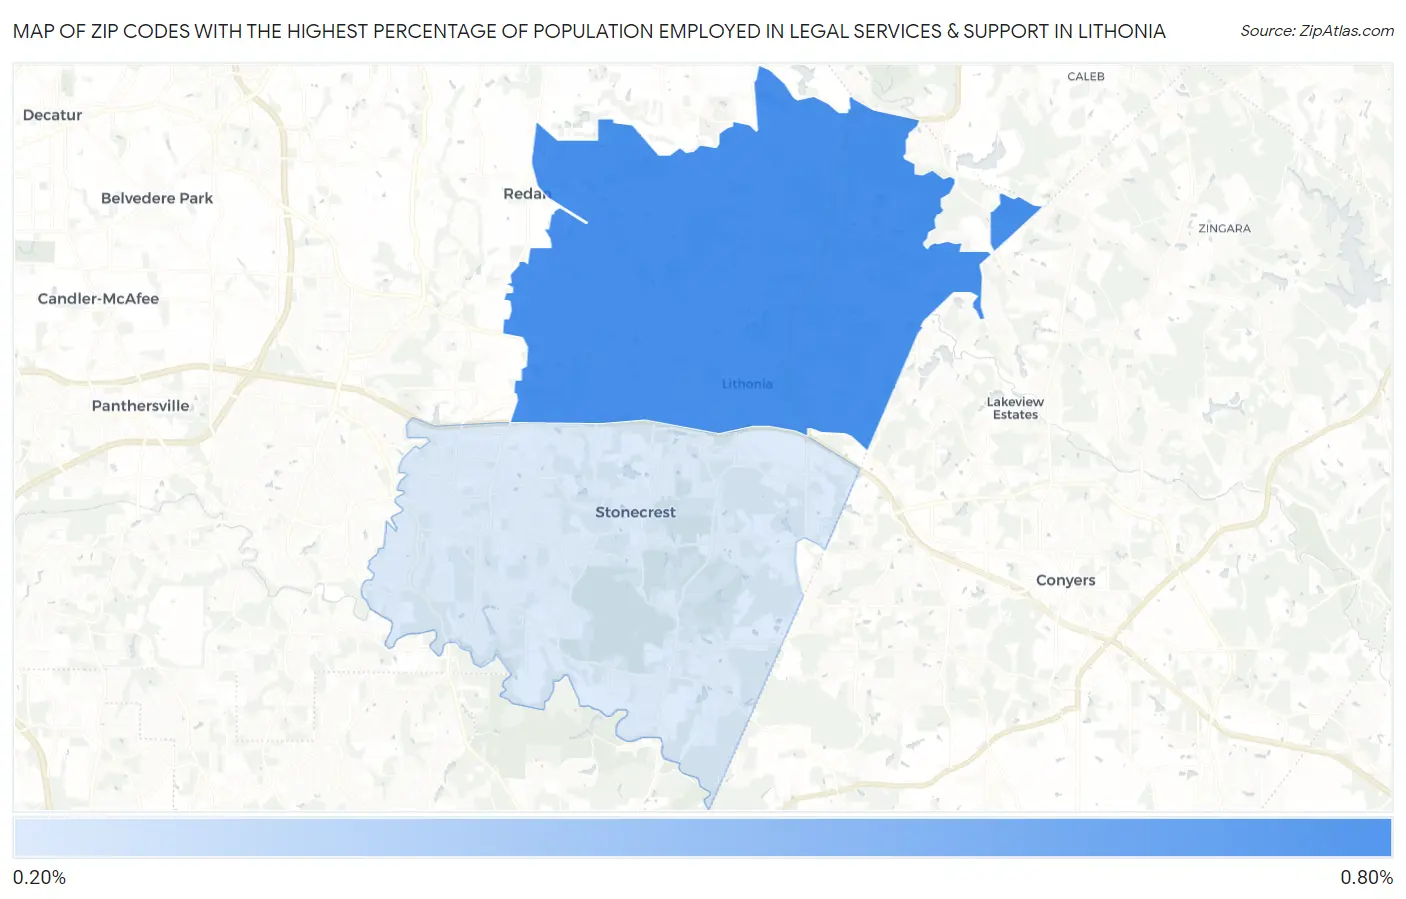
Map of Zip Codes with the Highest Percentage of Population Employed in Legal Services & Support in Lithonia
0.0%
0.80%
Zip Codes with the Highest Percentage of Population Employed in Legal Services & Support in Lithonia, GA
| Zip Code | % Employed | vs State | vs National | |
| 1. | 30058 | 0.74% | 1.1%(-0.366)#242 | 1.2%(-0.446)#10,026 |
| 2. | 30038 | 0.29% | 1.1%(-0.811)#378 | 1.2%(-0.891)#15,127 |
1
Common Questions
What are the Top Zip Codes with the Highest Percentage of Population Employed in Legal Services & Support in Lithonia, GA?
Top Zip Codes with the Highest Percentage of Population Employed in Legal Services & Support in Lithonia, GA are:
What zip code has the Highest Percentage of Population Employed in Legal Services & Support in Lithonia, GA?
30058 has the Highest Percentage of Population Employed in Legal Services & Support in Lithonia, GA with 0.74%.
What is the Percentage of Population Employed in Legal Services & Support in Georgia?
Percentage of Population Employed in Legal Services & Support in Georgia is 1.1%.
What is the Percentage of Population Employed in Legal Services & Support in the United States?
Percentage of Population Employed in Legal Services & Support in the United States is 1.2%.