Zip Codes with the Highest Percentage of Population Employed in Architecture & Engineering in Stone Mountain, GA
RELATED REPORTS & OPTIONS
Architecture & Engineering
Stone Mountain
Compare Zip Codes
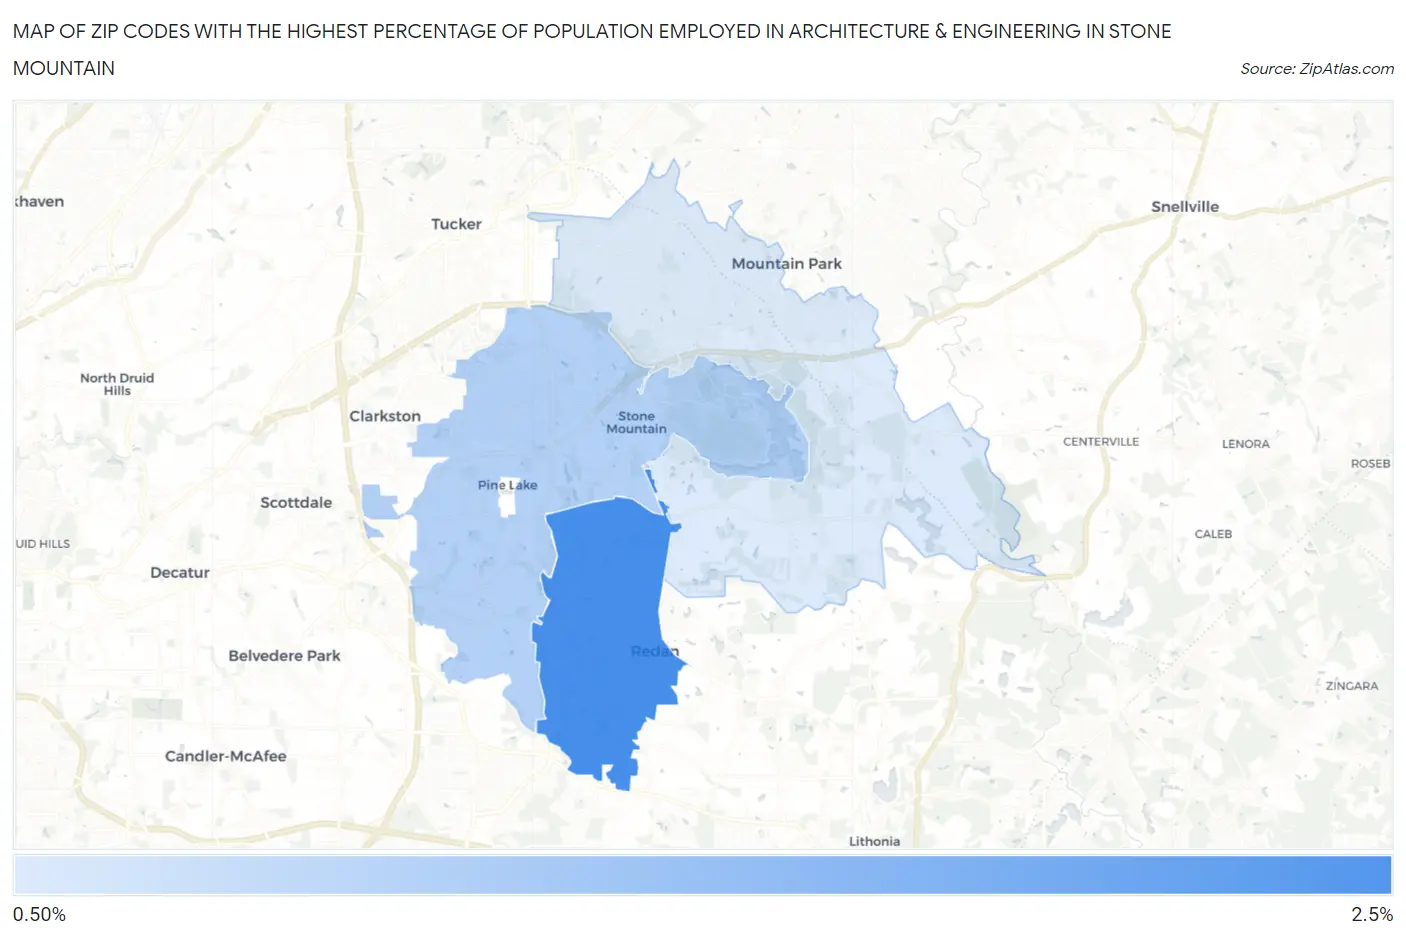
Map of Zip Codes with the Highest Percentage of Population Employed in Architecture & Engineering in Stone Mountain
0.0%
2.5%
Zip Codes with the Highest Percentage of Population Employed in Architecture & Engineering in Stone Mountain, GA
| Zip Code | % Employed | vs State | vs National | |
| 1. | 30088 | 2.5% | 1.8%(+0.696)#124 | 2.1%(+0.342)#7,032 |
| 2. | 30083 | 1.4% | 1.8%(-0.410)#267 | 2.1%(-0.764)#13,695 |
| 3. | 30087 | 0.97% | 1.8%(-0.823)#344 | 2.1%(-1.18)#16,812 |
1
Common Questions
What are the Top Zip Codes with the Highest Percentage of Population Employed in Architecture & Engineering in Stone Mountain, GA?
Top Zip Codes with the Highest Percentage of Population Employed in Architecture & Engineering in Stone Mountain, GA are:
What zip code has the Highest Percentage of Population Employed in Architecture & Engineering in Stone Mountain, GA?
30088 has the Highest Percentage of Population Employed in Architecture & Engineering in Stone Mountain, GA with 2.5%.
What is the Percentage of Population Employed in Architecture & Engineering in Stone Mountain, GA?
Percentage of Population Employed in Architecture & Engineering in Stone Mountain is 0.68%.
What is the Percentage of Population Employed in Architecture & Engineering in Georgia?
Percentage of Population Employed in Architecture & Engineering in Georgia is 1.8%.
What is the Percentage of Population Employed in Architecture & Engineering in the United States?
Percentage of Population Employed in Architecture & Engineering in the United States is 2.1%.