Zip Codes with the Highest Percentage of Population Employed in Architecture & Engineering in Snellville, GA
RELATED REPORTS & OPTIONS
Architecture & Engineering
Snellville
Compare Zip Codes
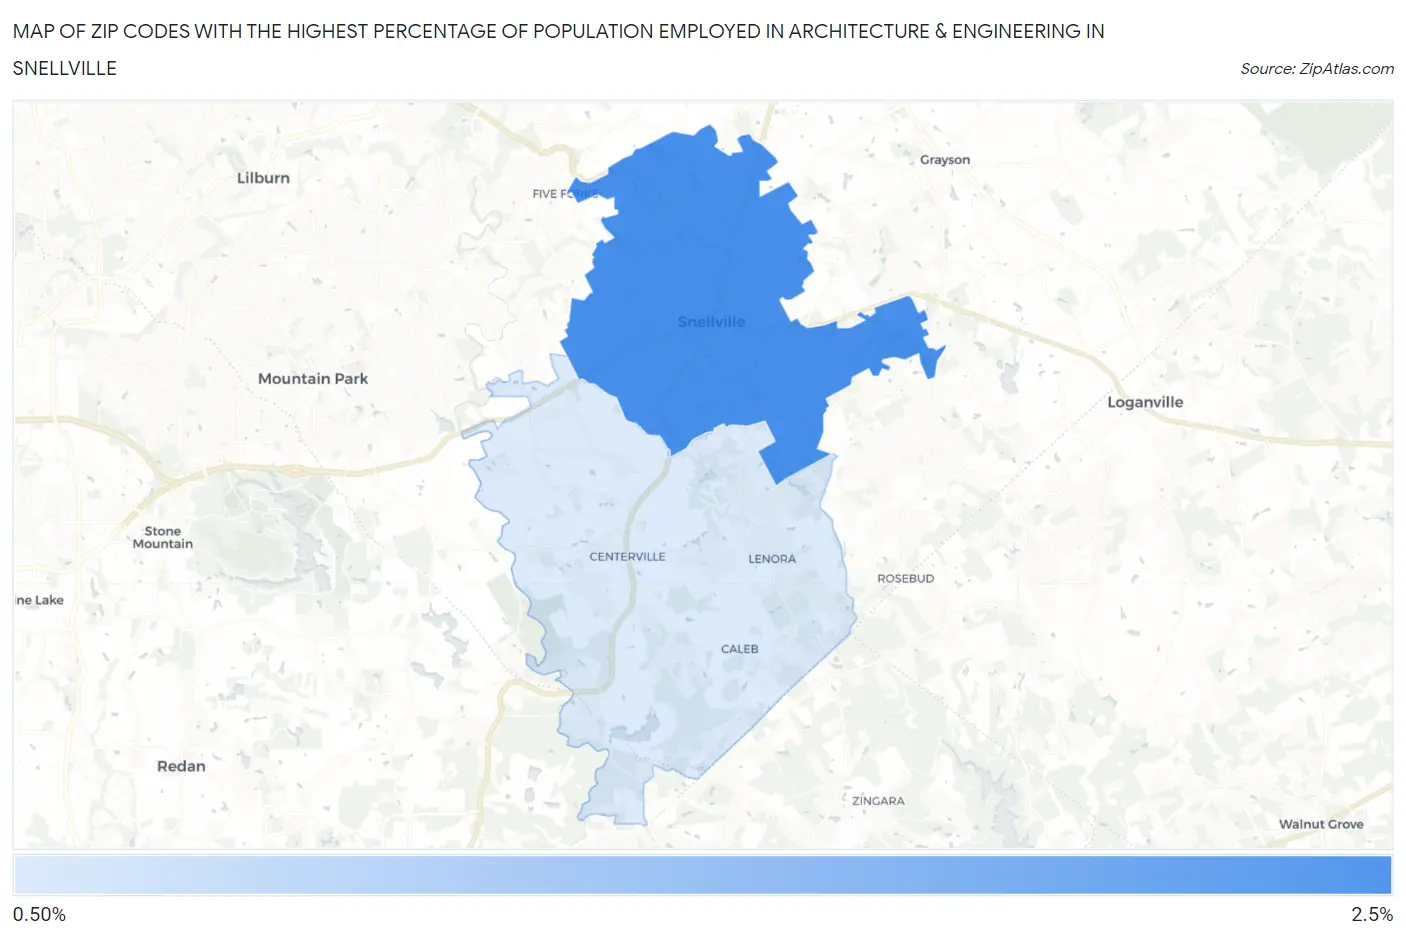
Map of Zip Codes with the Highest Percentage of Population Employed in Architecture & Engineering in Snellville
0.0%
2.5%
Zip Codes with the Highest Percentage of Population Employed in Architecture & Engineering in Snellville, GA
| Zip Code | % Employed | vs State | vs National | |
| 1. | 30078 | 2.1% | 1.8%(+0.277)#179 | 2.1%(-0.077)#9,197 |
| 2. | 30039 | 1.4% | 1.8%(-0.360)#264 | 2.1%(-0.714)#13,333 |
1
Common Questions
What are the Top Zip Codes with the Highest Percentage of Population Employed in Architecture & Engineering in Snellville, GA?
Top Zip Codes with the Highest Percentage of Population Employed in Architecture & Engineering in Snellville, GA are:
What zip code has the Highest Percentage of Population Employed in Architecture & Engineering in Snellville, GA?
30078 has the Highest Percentage of Population Employed in Architecture & Engineering in Snellville, GA with 2.1%.
What is the Percentage of Population Employed in Architecture & Engineering in Snellville, GA?
Percentage of Population Employed in Architecture & Engineering in Snellville is 1.7%.
What is the Percentage of Population Employed in Architecture & Engineering in Georgia?
Percentage of Population Employed in Architecture & Engineering in Georgia is 1.8%.
What is the Percentage of Population Employed in Architecture & Engineering in the United States?
Percentage of Population Employed in Architecture & Engineering in the United States is 2.1%.