Zip Codes with the Highest Percentage of Population with a Degree in Liberal Arts and History in Norcross, GA
RELATED REPORTS & OPTIONS
Liberal Arts and History
Norcross
Compare Zip Codes
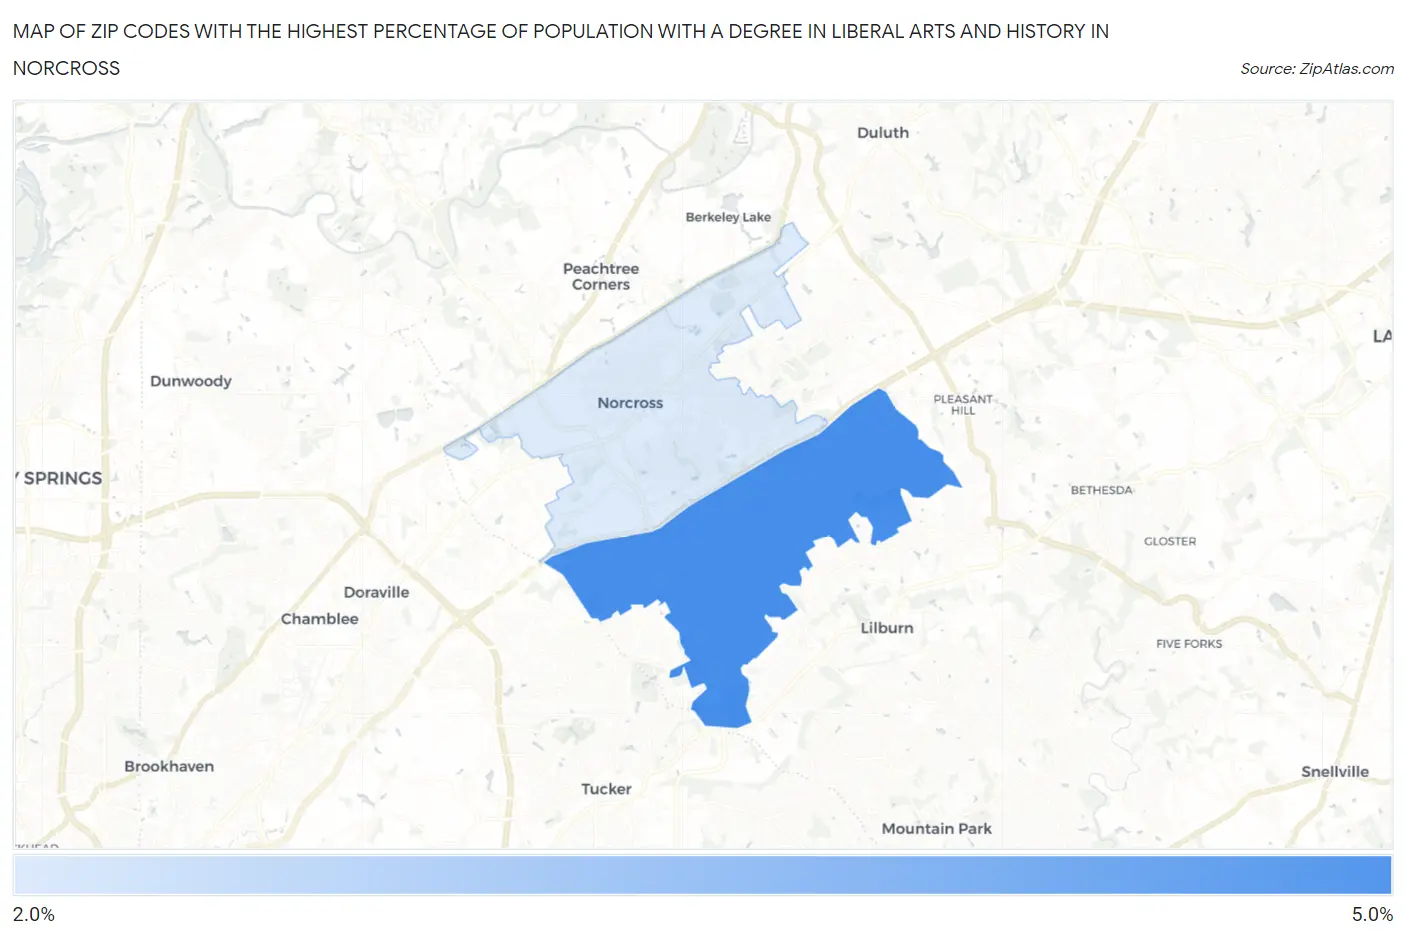
Map of Zip Codes with the Highest Percentage of Population with a Degree in Liberal Arts and History in Norcross
0.0%
5.0%
Zip Codes with the Highest Percentage of Population with a Degree in Liberal Arts and History in Norcross, GA
| Zip Code | % Graduates | vs State | vs National | |
| 1. | 30093 | 5.0% | 4.1%(+0.837)#228 | 4.9%(+0.091)#11,458 |
| 2. | 30071 | 2.4% | 4.1%(-1.72)#459 | 4.9%(-2.47)#20,257 |
1
Common Questions
What are the Top Zip Codes with the Highest Percentage of Population with a Degree in Liberal Arts and History in Norcross, GA?
Top Zip Codes with the Highest Percentage of Population with a Degree in Liberal Arts and History in Norcross, GA are:
What zip code has the Highest Percentage of Population with a Degree in Liberal Arts and History in Norcross, GA?
30093 has the Highest Percentage of Population with a Degree in Liberal Arts and History in Norcross, GA with 5.0%.
What is the Percentage of Population with a Degree in Liberal Arts and History in Norcross, GA?
Percentage of Population with a Degree in Liberal Arts and History in Norcross is 2.5%.
What is the Percentage of Population with a Degree in Liberal Arts and History in Georgia?
Percentage of Population with a Degree in Liberal Arts and History in Georgia is 4.1%.
What is the Percentage of Population with a Degree in Liberal Arts and History in the United States?
Percentage of Population with a Degree in Liberal Arts and History in the United States is 4.9%.