Zip Codes with the Highest Percentage of Population Employed in Farming, Fishing & Forestry in Norcross, GA
RELATED REPORTS & OPTIONS
Farming, Fishing & Forestry
Norcross
Compare Zip Codes
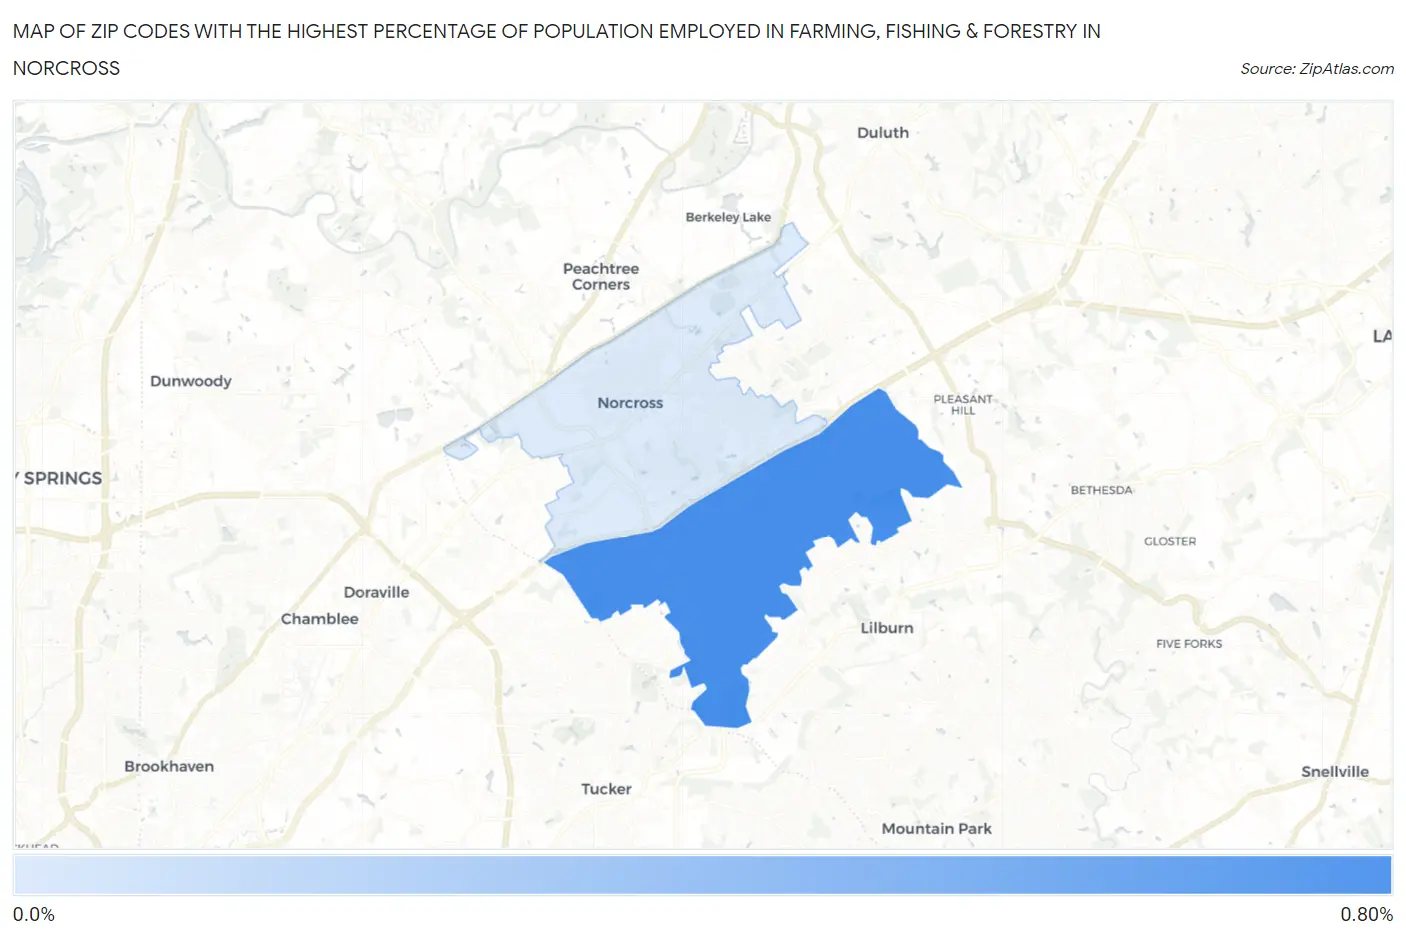
Map of Zip Codes with the Highest Percentage of Population Employed in Farming, Fishing & Forestry in Norcross
0.0%
0.80%
Zip Codes with the Highest Percentage of Population Employed in Farming, Fishing & Forestry in Norcross, GA
| Zip Code | % Employed | vs State | vs National | |
| 1. | 30093 | 0.76% | 0.45%(+0.310)#227 | 0.61%(+0.156)#11,010 |
| 2. | 30071 | 0.068% | 0.45%(-0.383)#412 | 0.61%(-0.537)#18,333 |
1
Common Questions
What are the Top Zip Codes with the Highest Percentage of Population Employed in Farming, Fishing & Forestry in Norcross, GA?
Top Zip Codes with the Highest Percentage of Population Employed in Farming, Fishing & Forestry in Norcross, GA are:
What zip code has the Highest Percentage of Population Employed in Farming, Fishing & Forestry in Norcross, GA?
30093 has the Highest Percentage of Population Employed in Farming, Fishing & Forestry in Norcross, GA with 0.76%.
What is the Percentage of Population Employed in Farming, Fishing & Forestry in Georgia?
Percentage of Population Employed in Farming, Fishing & Forestry in Georgia is 0.45%.
What is the Percentage of Population Employed in Farming, Fishing & Forestry in the United States?
Percentage of Population Employed in Farming, Fishing & Forestry in the United States is 0.61%.