Zip Codes with the Highest Percentage of Population with a Degree in Liberal Arts and History in Woodstock, GA
RELATED REPORTS & OPTIONS
Liberal Arts and History
Woodstock
Compare Zip Codes
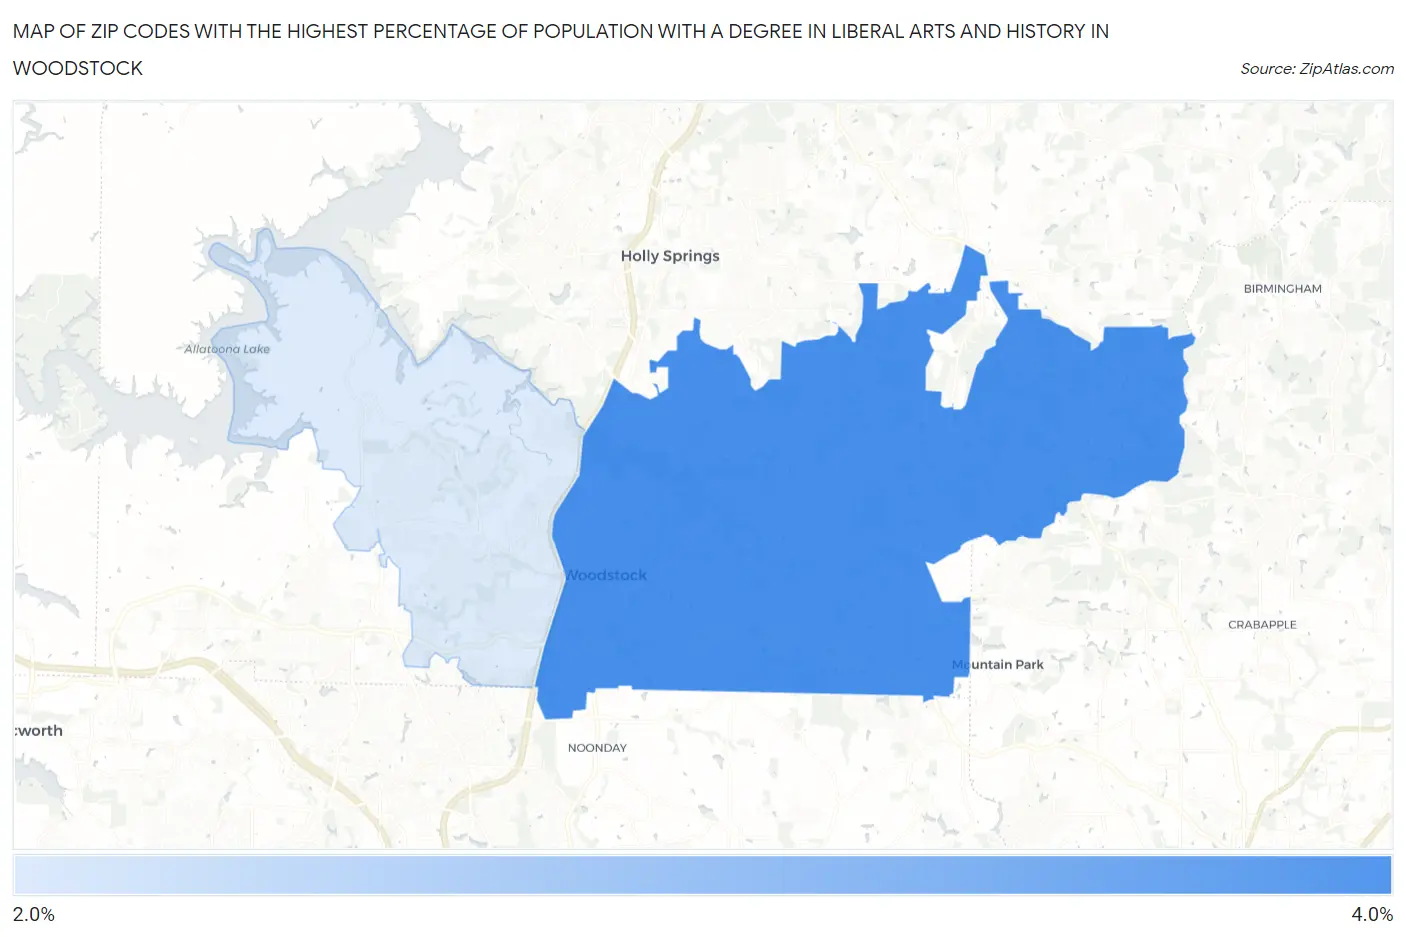
Map of Zip Codes with the Highest Percentage of Population with a Degree in Liberal Arts and History in Woodstock
0.0%
4.0%
Zip Codes with the Highest Percentage of Population with a Degree in Liberal Arts and History in Woodstock, GA
| Zip Code | % Graduates | vs State | vs National | |
| 1. | 30188 | 3.8% | 4.1%(-0.336)#341 | 4.9%(-1.08)#15,563 |
| 2. | 30189 | 2.6% | 4.1%(-1.50)#445 | 4.9%(-2.25)#19,576 |
1
Common Questions
What are the Top Zip Codes with the Highest Percentage of Population with a Degree in Liberal Arts and History in Woodstock, GA?
Top Zip Codes with the Highest Percentage of Population with a Degree in Liberal Arts and History in Woodstock, GA are:
What zip code has the Highest Percentage of Population with a Degree in Liberal Arts and History in Woodstock, GA?
30188 has the Highest Percentage of Population with a Degree in Liberal Arts and History in Woodstock, GA with 3.8%.
What is the Percentage of Population with a Degree in Liberal Arts and History in Woodstock, GA?
Percentage of Population with a Degree in Liberal Arts and History in Woodstock is 2.8%.
What is the Percentage of Population with a Degree in Liberal Arts and History in Georgia?
Percentage of Population with a Degree in Liberal Arts and History in Georgia is 4.1%.
What is the Percentage of Population with a Degree in Liberal Arts and History in the United States?
Percentage of Population with a Degree in Liberal Arts and History in the United States is 4.9%.