Zip Codes with the Highest Percentage of Population Employed in Farming, Fishing & Forestry in Bainbridge, GA
RELATED REPORTS & OPTIONS
Farming, Fishing & Forestry
Bainbridge
Compare Zip Codes
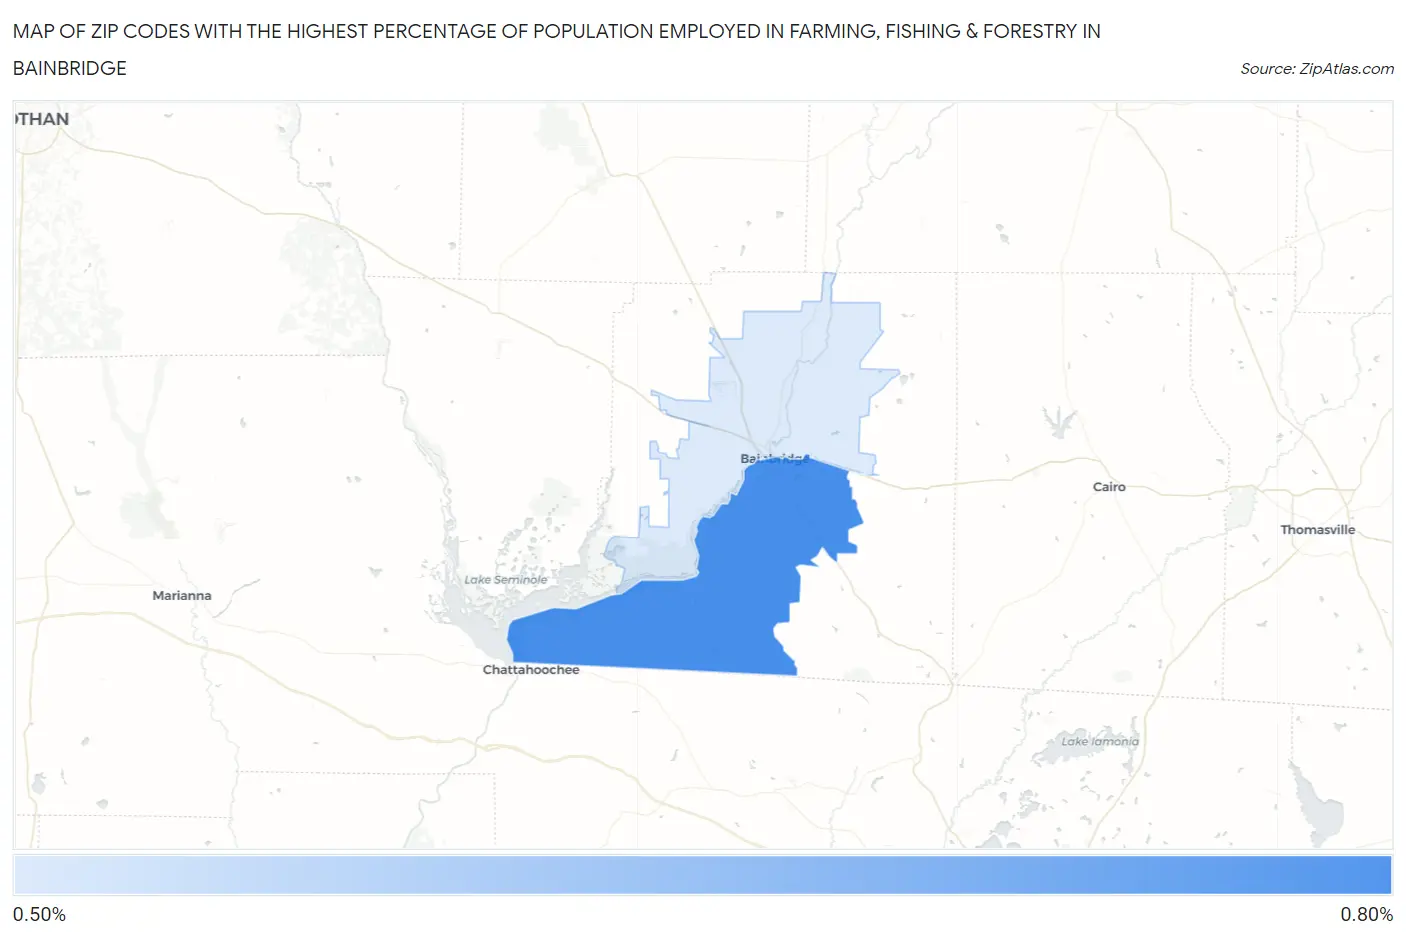
Map of Zip Codes with the Highest Percentage of Population Employed in Farming, Fishing & Forestry in Bainbridge
0.0%
0.80%
Zip Codes with the Highest Percentage of Population Employed in Farming, Fishing & Forestry in Bainbridge, GA
| Zip Code | % Employed | vs State | vs National | |
| 1. | 39819 | 0.75% | 0.45%(+0.296)#234 | 0.61%(+0.142)#11,090 |
| 2. | 39817 | 0.59% | 0.45%(+0.134)#259 | 0.61%(-0.020)#12,156 |
1
Common Questions
What are the Top Zip Codes with the Highest Percentage of Population Employed in Farming, Fishing & Forestry in Bainbridge, GA?
Top Zip Codes with the Highest Percentage of Population Employed in Farming, Fishing & Forestry in Bainbridge, GA are:
What zip code has the Highest Percentage of Population Employed in Farming, Fishing & Forestry in Bainbridge, GA?
39819 has the Highest Percentage of Population Employed in Farming, Fishing & Forestry in Bainbridge, GA with 0.75%.
What is the Percentage of Population Employed in Farming, Fishing & Forestry in Bainbridge, GA?
Percentage of Population Employed in Farming, Fishing & Forestry in Bainbridge is 0.23%.
What is the Percentage of Population Employed in Farming, Fishing & Forestry in Georgia?
Percentage of Population Employed in Farming, Fishing & Forestry in Georgia is 0.45%.
What is the Percentage of Population Employed in Farming, Fishing & Forestry in the United States?
Percentage of Population Employed in Farming, Fishing & Forestry in the United States is 0.61%.