Zip Codes with the Highest Percentage of Population Employed in Farming, Fishing & Forestry in Milledgeville, GA
RELATED REPORTS & OPTIONS
Farming, Fishing & Forestry
Milledgeville
Compare Zip Codes
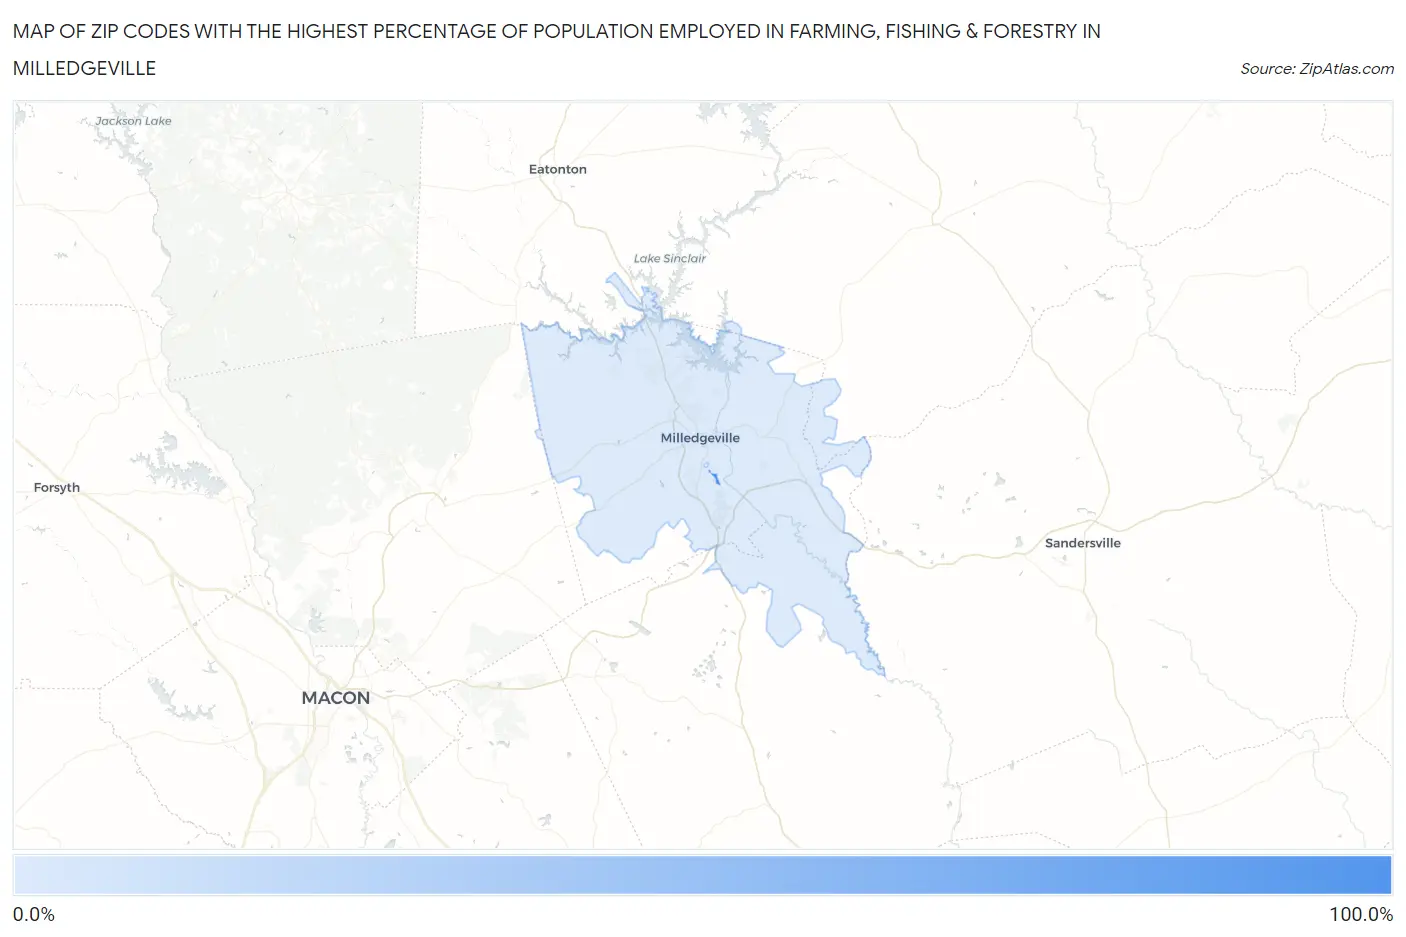
Map of Zip Codes with the Highest Percentage of Population Employed in Farming, Fishing & Forestry in Milledgeville
0.0%
100.0%
Zip Codes with the Highest Percentage of Population Employed in Farming, Fishing & Forestry in Milledgeville, GA
| Zip Code | % Employed | vs State | vs National | |
| 1. | 31062 | 100.0% | 0.45%(+99.5)#1 | 0.61%(+99.4)#7 |
| 2. | 31061 | 0.19% | 0.45%(-0.260)#362 | 0.61%(-0.414)#16,257 |
1
Common Questions
What are the Top Zip Codes with the Highest Percentage of Population Employed in Farming, Fishing & Forestry in Milledgeville, GA?
Top Zip Codes with the Highest Percentage of Population Employed in Farming, Fishing & Forestry in Milledgeville, GA are:
What zip code has the Highest Percentage of Population Employed in Farming, Fishing & Forestry in Milledgeville, GA?
31062 has the Highest Percentage of Population Employed in Farming, Fishing & Forestry in Milledgeville, GA with 100.0%.
What is the Percentage of Population Employed in Farming, Fishing & Forestry in Milledgeville, GA?
Percentage of Population Employed in Farming, Fishing & Forestry in Milledgeville is 0.50%.
What is the Percentage of Population Employed in Farming, Fishing & Forestry in Georgia?
Percentage of Population Employed in Farming, Fishing & Forestry in Georgia is 0.45%.
What is the Percentage of Population Employed in Farming, Fishing & Forestry in the United States?
Percentage of Population Employed in Farming, Fishing & Forestry in the United States is 0.61%.