Zip Codes with the Highest Percentage of Population Employed in Agriculture, Fishing & Hunting in Milledgeville, GA
RELATED REPORTS & OPTIONS
Agriculture, Fishing & Hunting
Milledgeville
Compare Zip Codes
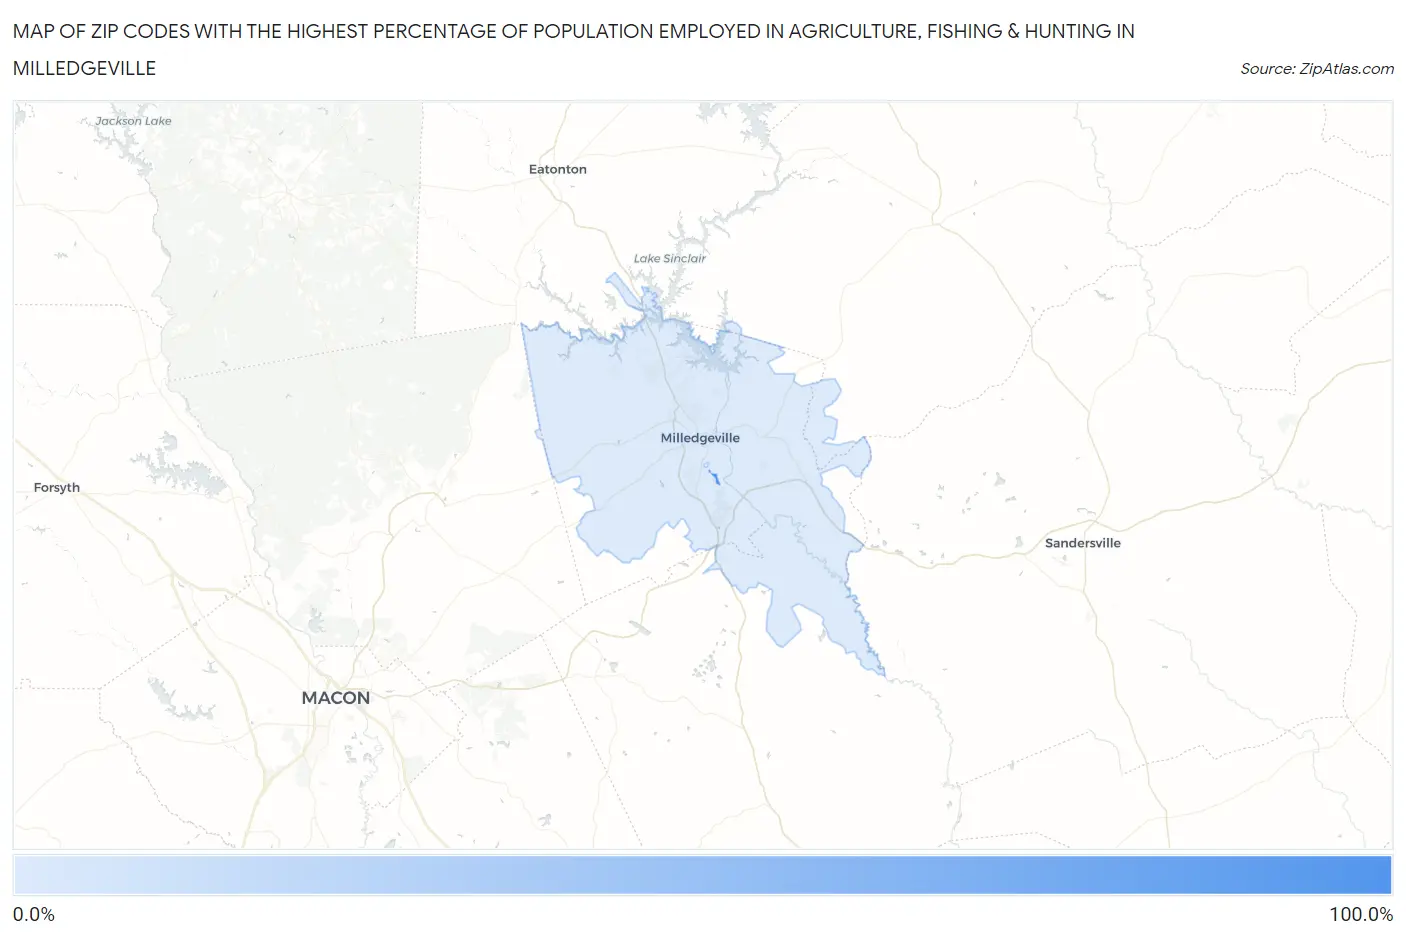
Map of Zip Codes with the Highest Percentage of Population Employed in Agriculture, Fishing & Hunting in Milledgeville
0.0%
100.0%
Zip Codes with the Highest Percentage of Population Employed in Agriculture, Fishing & Hunting in Milledgeville, GA
| Zip Code | % Employed | vs State | vs National | |
| 1. | 31062 | 100.0% | 0.91%(+99.1)#1 | 1.2%(+98.8)#27 |
| 2. | 31061 | 0.49% | 0.91%(-0.422)#419 | 1.2%(-0.712)#19,384 |
1
Common Questions
What are the Top Zip Codes with the Highest Percentage of Population Employed in Agriculture, Fishing & Hunting in Milledgeville, GA?
Top Zip Codes with the Highest Percentage of Population Employed in Agriculture, Fishing & Hunting in Milledgeville, GA are:
What zip code has the Highest Percentage of Population Employed in Agriculture, Fishing & Hunting in Milledgeville, GA?
31062 has the Highest Percentage of Population Employed in Agriculture, Fishing & Hunting in Milledgeville, GA with 100.0%.
What is the Percentage of Population Employed in Agriculture, Fishing & Hunting in Milledgeville, GA?
Percentage of Population Employed in Agriculture, Fishing & Hunting in Milledgeville is 0.67%.
What is the Percentage of Population Employed in Agriculture, Fishing & Hunting in Georgia?
Percentage of Population Employed in Agriculture, Fishing & Hunting in Georgia is 0.91%.
What is the Percentage of Population Employed in Agriculture, Fishing & Hunting in the United States?
Percentage of Population Employed in Agriculture, Fishing & Hunting in the United States is 1.2%.