Zip Codes with the Highest Percentage of Population Employed in Administrative & Support Services in Bainbridge, GA
RELATED REPORTS & OPTIONS
Administrative & Support Services
Bainbridge
Compare Zip Codes
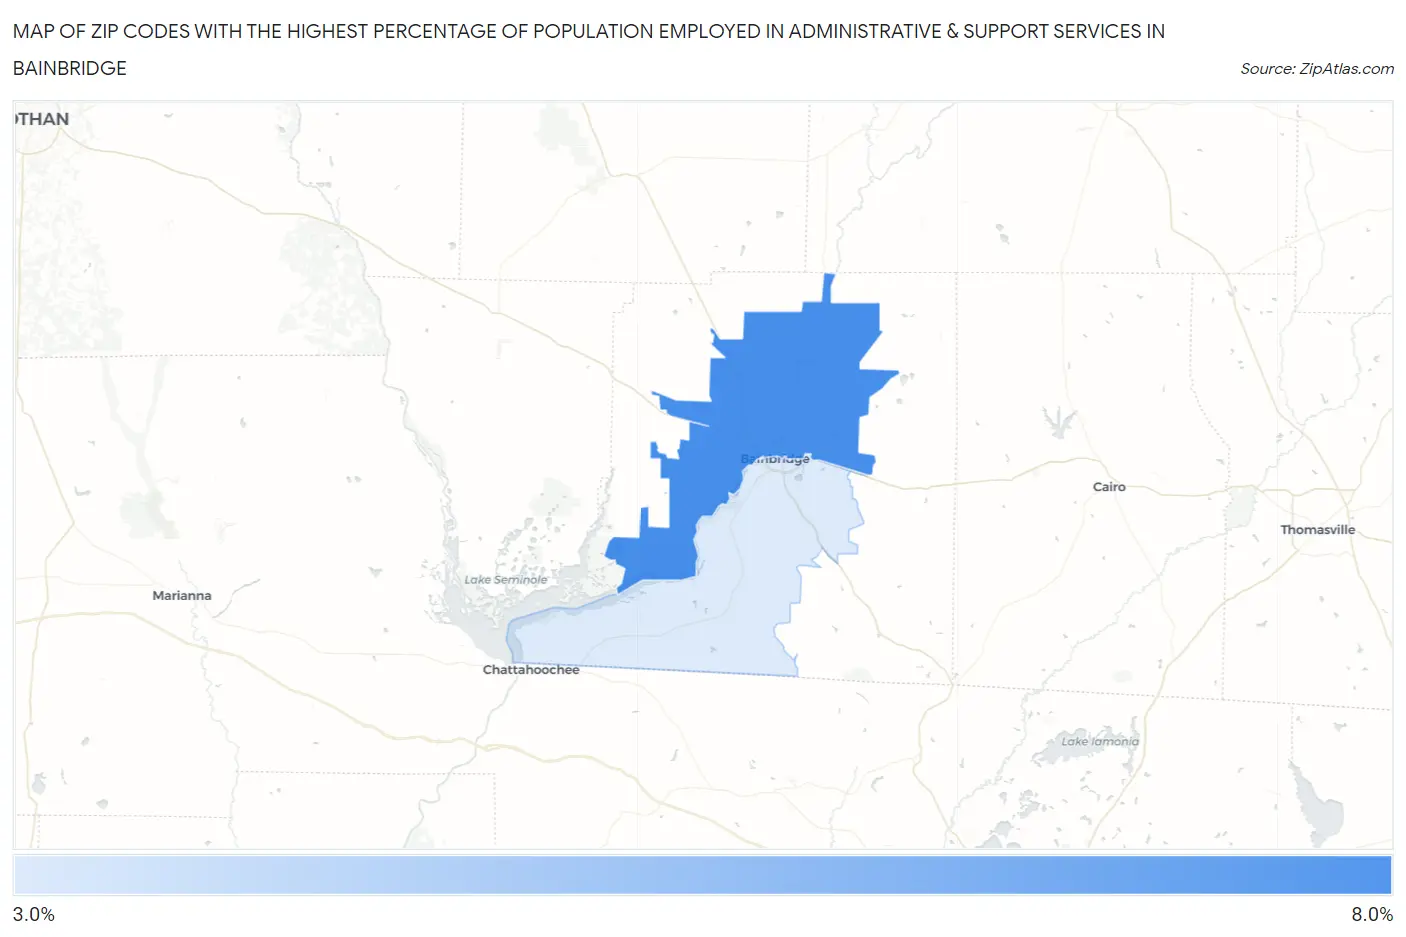
Map of Zip Codes with the Highest Percentage of Population Employed in Administrative & Support Services in Bainbridge
0.0%
8.0%
Zip Codes with the Highest Percentage of Population Employed in Administrative & Support Services in Bainbridge, GA
| Zip Code | % Employed | vs State | vs National | |
| 1. | 39817 | 6.3% | 4.8%(+1.51)#136 | 4.1%(+2.18)#4,189 |
| 2. | 39819 | 3.2% | 4.8%(-1.63)#424 | 4.1%(-0.963)#14,540 |
1
Common Questions
What are the Top Zip Codes with the Highest Percentage of Population Employed in Administrative & Support Services in Bainbridge, GA?
Top Zip Codes with the Highest Percentage of Population Employed in Administrative & Support Services in Bainbridge, GA are:
What zip code has the Highest Percentage of Population Employed in Administrative & Support Services in Bainbridge, GA?
39817 has the Highest Percentage of Population Employed in Administrative & Support Services in Bainbridge, GA with 6.3%.
What is the Percentage of Population Employed in Administrative & Support Services in Bainbridge, GA?
Percentage of Population Employed in Administrative & Support Services in Bainbridge is 4.2%.
What is the Percentage of Population Employed in Administrative & Support Services in Georgia?
Percentage of Population Employed in Administrative & Support Services in Georgia is 4.8%.
What is the Percentage of Population Employed in Administrative & Support Services in the United States?
Percentage of Population Employed in Administrative & Support Services in the United States is 4.1%.